Zabbix and Prometheus

Zabbix is my favorite network monitoring solution despite having one or two flaws. It comes with great templates for servers, networking equipment and applications. I have had to put together my own crude templates for MongoDB, Samba, DNS lookups, Btrfs file systems and LVM thin pools but MySQL, Elasticsearch, Ceph and more has been effortless(-ish) to setup monitoring for in Zabbix. My main dashboard shows a list of problems, graphs over network usage and server load on the physical servers:

Admin/backup refers to my old HPE switch which is normally only used for IPMI but it’s part of a RSTP-setup so if something goes wrong with my new Aruba switch the old HPE will make sure the servers can communicate with each other and the gateway.

A nice feature in Zabbix is setting downtime so as to avoid lots of alerts when rebooting nodes or doing similar maintenance. One issue I have is that Zabbix is not designed for cluster use. It’s technically not impossible to have two parallel instances running but then you’ll get a lot of wonky data as two nodes add and subtract data from the database without knowing about each other. I think a Pacemaker-setup that enforces mutual exclusion would work but I don’t really have a need for that. I am thinking about running Zabbix as a Docker container to make it easier to spin up on a backup server when I have to take a server down for maintenance.

Zabbix is extensible with both your own templates and custom data collection mechanisms. For instance I added this in zabbix_agent.conf on my MongoDB nodes to provide data for the Zabbix server:

UserParameter=mongodb.uptime, /etc/zabbix/mongodb_uptime.sh
UserParameter=mongodb.reachable, mongo --eval "rs.status().ok" | tail -1

Ordinary commands, calls to scripts and pretty much everything in between. Consider formatting it as JSON if it’s more than scalar values being passed back to the Zabbix server.

I only just learned today that Zabbix also has a function for running commands in response to error states: https://www.zabbix.com/documentation/current/manual/config/notifications/action/operation/remote_command

I don’t usually run in to repeat problems on my systems(no silly customers causing trouble and hardly any publically facing services) that make it sensible to use that but at work we could definitely use that kind of solution.

That leads me to a downside to Zabbix, the RDBMS backend… I run MariaDB master/slave now but used MariaDB Galera before and it works fine for my needs. I’m not sure how well Zabbix scales though. For my modest network with 21 active data collection sources we have around 40 queries per second but if we were talking about 21 physical servers and 500 virtual machines… Not to mention that RDBMS are kind of a pain generally since they don’t respond well to unexpected shutdowns and such.

Prometheus

Zabbix does its job exceedingly well but it’s also kind of boring and… not modern. So for every mention of Zabbix you’ll see 1000 mentions about Prometheus. Despite being a bit of a Zabbix fan boy, I have to give credit to Prometheus for doing performance monitoring really well. It’s not just a lot of hype about Prometheus, it’s actually quite good. It is very efficient when it comes to storing time series data which it does using an internal storage system and not a sensitive RDBMS-arrangement.

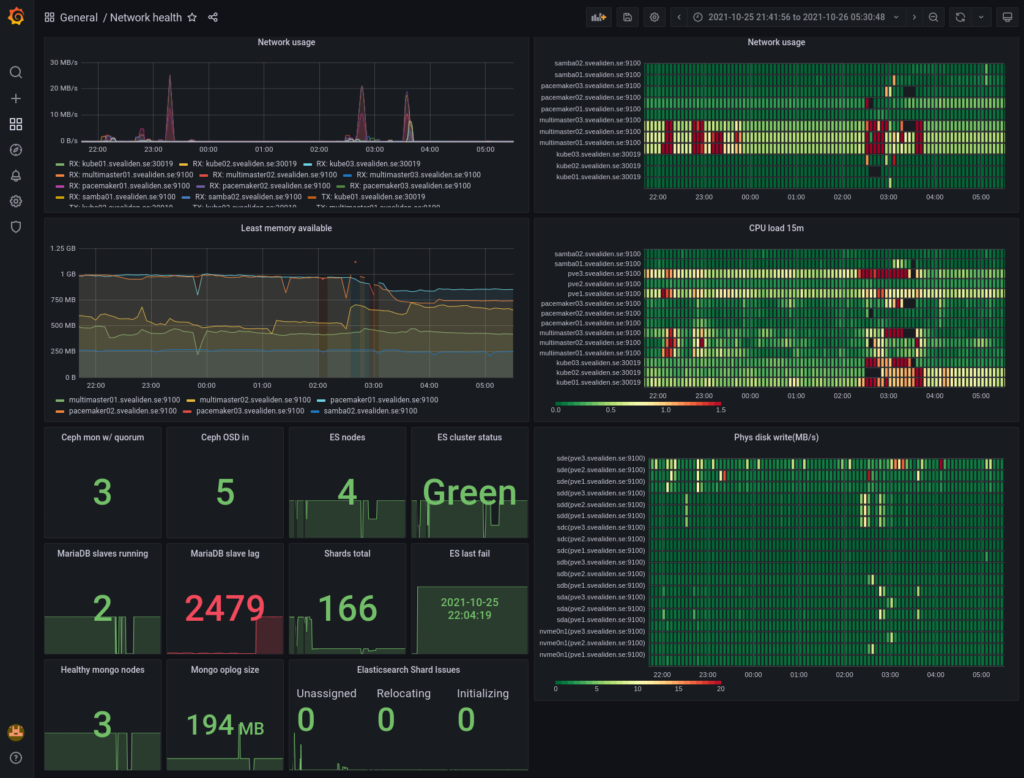
It comes with it’s own crude table-and-graphing web UI. Using something like Grafana is however recommended for production use when presenting Prometheus data. For instance, here is dashboard of Prometheus data for my network indicating if things are overloaded or degraded(during a big upgrade yesterday):

As you can see, I like heatmaps. Red are peaks in usage and black squares(well, rectangles…) are periods where data is missing. It normally looks like this:

There are lots of “exporters” as clients are called in Prometheus for exporting data about Linux servers and applications and it’s also easy to write your own. I have an exporter for gathering packet loss-data both on my own network and against external servers and it took me like 45 minutes to do, starting with no knowledge of what a Prometheus exporter is or how it works. With a node exporter for something like MySQL and a provided Grafana dashboard you can get really good monitoring in a very short period of time. My MySQL master for instance:

Where Prometheus is kind of weak is alerting which has to be done through rules read into the Prometheus config file: https://prometheus.io/docs/prometheus/latest/configuration/alerting_rules/

It’s not that it doesn’t work but Zabbix does this more conveniently and has it’s own interface for presenting alerts, acknowledging them and so on. Prometheus has an alert manager sidecar sort of thing but I’m preferring to implement all important alerts in Zabbix and using Prometheus alerts only for more general “something doesn’t seem quite right” performance stuff.

All in all I wouldn’t want to rely on Zabbix for performance metrics and I certainly wouldn’t want to have to rely on Prometheus for alerting. If I had to deal with thousands of servers running hundreds of thousands of application instances or something crazy like that I’d go with Prometheus, not least thanks to its federation-capability of summarizing data upwards in a tree of Prometheus instances, never mind that I’d have to write a bunch of rules manually that I’d get for free with Zabbix.

Federation could also be used for higher availability though it would be a little bit weird perhaps. Well, no… If you just let a backup gather data while the primary is rebooted and then let the primary read the data it missed from the backup then we’d be back where we wanted to be, right? I guess I should try out that federation stuff some time.

Quick note on network debugging

Dropwatch to monitor packet drops in real time:

dnf install dropwatch
dropwatch –help
dropwatch -l kas
dropwatch> start

perf to figure out which software is making calls whose packets are dropped:

dnf install perf -y
perf record -g -a -e skb:kfree_skb
perf script

Log packets processed in iptables to dmesg:

iptables-legacy -t raw -A PREROUTING -p tcp –dport 9100 -j TRACE
dmesg
dmesg > dump.txt
ls -lh dump.txt
iptables-legacy -t raw -D PREROUTING -p tcp –dport 9100 -j TRACE

Still haven’t figured out why Kubernetes keeps dropping packets intermittently on one of three nodes(which one changes are workloads move around). It’s not conntrack being full or the pod receiving the traffic that’s dropping. It just enters ens18 and never enters the correct calico virtual interface so odds are the kernel drops ’em.

I can’t say I’m saddened by this turn of events. This is precisely the sort of stuff that I’ve been ranting about with this kind of “we handle it for you magically” stuff. Great when it works, not so great when you have to trace intermittent packet loss in a patchwork of vxlan and iptables entries managed by shadowy puppetmaster who doesn’t explain himself.

calico-node’s log with logscreenseverity set to debug and filelogging active:

2021-10-16 22:56:43.035 [INFO][8] startup.go 215: Using node name: kube02.svealiden.se
2021-10-16 22:56:43.196 [INFO][17] allocateip.go 144: Current address is still valid, do nothing currentAddr="10.1.173.128" type="vxlanTunnelAddress"
CALICO_NETWORKING_BACKEND is vxlan - no need to run a BGP daemon
Calico node started successfully

That was almost 4 hours ago…

Had a look at Nomad but I’m a little bit skeptical of that too. You seem to need Nomad, Consul and some networking thing to get a useful stack.

Kubernetes and clusters in general

I’ve hated Kubernetes for a long time. Must be nigh on seven years at this point. I got in pretty early when Traefik wasn’t around and it was generally not viable to run a Kubernetes cluster outside the cloud due to the lack of LoadBalancer implementations. StatefulSets weren’t a thing. But everyone else seems to have been crazy for it.

Maybe what made me hostile to Kubernetes was its way of pawning off all the difficult parts of clustering to someone else. When you don’t have to deal with state and mutual exclusion, clustering becomes way easier. But that’s not really solving the underlying problem, just saying “If you figured out the hard parts, feel free to use Kubernetes to simplify the other parts”.

It also doesn’t work in its favor that it is so complex and obtuse. I’ve spent years tinkering with it(on and off naturally, I don’t engage that frequently with things I hate) and over the past few weeks I’ve got a working setup using microk8s and Rook that lets me create persistent volumes in my external Ceph cluster running on Proxmox. I now run my web UI for the pdns authoritative DNS servers in that cluster using a Deployment that can be scaled quite easily:

[root@kube01 ~]# mkctl get pods -o wide
NAME                                    READY   STATUS    RESTARTS   AGE   IP              NODE                  NOMINATED NODE   READINESS GATES
traefik-ingress-controller-gmf7k        1/1     Running   1          20h   192.168.1.172   kube02.svealiden.se   <none>           <none>
traefik-ingress-controller-94clq        1/1     Running   1          20h   192.168.1.173   kube03.svealiden.se   <none>           <none>
traefik-ingress-controller-77fxr        1/1     Running   1          20h   192.168.1.171   kube01.svealiden.se   <none>           <none>
whoami-78447d957f-t82sd                 1/1     Running   1          20h   10.1.154.29     kube01.svealiden.se   <none>           <none>
whoami-78447d957f-bwg7p                 1/1     Running   1          20h   10.1.154.30     kube01.svealiden.se   <none>           <none>
pdnsadmin-deployment-856dcfdfd8-5d45p   1/1     Running   0          50s   10.1.173.137    kube02.svealiden.se   <none>           <none>
pdnsadmin-deployment-856dcfdfd8-rdv88   1/1     Running   0          50s   10.1.246.237    kube03.svealiden.se   <none>           <none>
pdnsadmin-deployment-856dcfdfd8-vmzws   1/1     Running   0          50s   10.1.154.44     kube01.svealiden.se   <none>           <none>

[root@kube01 ~]# mkctl scale deployment.v1.apps/pdnsgui-deployment --replicas=2
Error from server (NotFound): deployments.apps "pdnsgui-deployment" not found

[root@kube01 ~]# mkctl get deployments
NAME                   READY   UP-TO-DATE   AVAILABLE   AGE
whoami                 2/2     2            2           20h
pdnsadmin-deployment   3/3     3            3           2m23s

[root@kube01 ~]# mkctl scale deployment.v1.apps/pdnsadmin-deployment --replicas=2
deployment.apps/pdnsadmin-deployment scaled

[root@kube01 ~]# mkctl get pods -o wide
NAME                                    READY   STATUS        RESTARTS   AGE     IP              NODE                  NOMINATED NODE   READINESS GATES
traefik-ingress-controller-gmf7k        1/1     Running       1          20h     192.168.1.172   kube02.svealiden.se   <none>           <none>
traefik-ingress-controller-94clq        1/1     Running       1          20h     192.168.1.173   kube03.svealiden.se   <none>           <none>
traefik-ingress-controller-77fxr        1/1     Running       1          20h     192.168.1.171   kube01.svealiden.se   <none>           <none>
whoami-78447d957f-t82sd                 1/1     Running       1          20h     10.1.154.29     kube01.svealiden.se   <none>           <none>
whoami-78447d957f-bwg7p                 1/1     Running       1          20h     10.1.154.30     kube01.svealiden.se   <none>           <none>
pdnsadmin-deployment-856dcfdfd8-rdv88   1/1     Running       0          2m33s   10.1.246.237    kube03.svealiden.se   <none>           <none>
pdnsadmin-deployment-856dcfdfd8-vmzws   1/1     Running       0          2m33s   10.1.154.44     kube01.svealiden.se   <none>           <none>
pdnsadmin-deployment-856dcfdfd8-5d45p   0/1     Terminating   0          2m33s   10.1.173.137    kube02.svealiden.se   <none>           <none>

[root@kube01 ~]# mkctl get pods -o wide
NAME                                    READY   STATUS    RESTARTS   AGE     IP              NODE                  NOMINATED NODE   READINESS GATES
traefik-ingress-controller-gmf7k        1/1     Running   1          20h     192.168.1.172   kube02.svealiden.se   <none>           <none>
traefik-ingress-controller-94clq        1/1     Running   1          20h     192.168.1.173   kube03.svealiden.se   <none>           <none>
traefik-ingress-controller-77fxr        1/1     Running   1          20h     192.168.1.171   kube01.svealiden.se   <none>           <none>
whoami-78447d957f-t82sd                 1/1     Running   1          20h     10.1.154.29     kube01.svealiden.se   <none>           <none>
whoami-78447d957f-bwg7p                 1/1     Running   1          20h     10.1.154.30     kube01.svealiden.se   <none>           <none>
pdnsadmin-deployment-856dcfdfd8-rdv88   1/1     Running   0          2m39s   10.1.246.237    kube03.svealiden.se   <none>           <none>
pdnsadmin-deployment-856dcfdfd8-vmzws   1/1     Running   0          2m39s   10.1.154.44     kube01.svealiden.se   <none>           <none>

Yet I have only the flimsiest idea of how it works and how to fix it if something breaks. Maybe I’ll learn how Calico uses vxlan to connect everything magically and why I had to reset my entire cluster on thursday to remove a custom resource definition.

By the way, try to create a custom resource definition not using the beta-API! You’ll have to provide a schema: https://kubernetes.io/docs/tasks/extend-kubernetes/custom-resources/custom-resource-definitions/

I suspect many people will go mad trying to make heads or tails of that. Anyway, if I had to make a decision about how to run a set of microservices in production I’d still go with something like docker containers run as systemd-services and HAProxy to load balance the traffic. Less automation for rolling upgrades, scaling and so on but I wouldn’t be worried about relying entirely on a system where it’s not even clear if I can find a way to describe the malfunction that keeps all services from running! I mean, I added podAntiAffinity to me deployment before:

affinity:
        podAntiAffinity:
          requiredDuringSchedulingIgnoredDuringExecution:
          - labelSelector:
              matchExpressions:
              - key: app
                operator: In
                values:
                - pdns-admin-gui
            topologyKey: "kubernetes.io/hostname"

And this is what all three pods logged when I started the deployment:

  Warning  FailedScheduling  39m   default-scheduler  0/3 nodes are available: 3 node(s) didn't match pod affinity/anti-affinity rules, 3 node(s) didn't match pod anti-affinity rules.
  Warning  FailedScheduling  39m   default-scheduler  0/3 nodes are available: 3 node(s) didn't match pod affinity/anti-affinity rules, 3 node(s) didn't match pod anti-affinity rules.
  Normal   Scheduled         39m   default-scheduler  Successfully assigned default/pdnsadmin-deployment-856dcfdfd8-vmzws to kube01.svealiden.se
  Normal   Pulled            39m   kubelet            Container image "cacher.svealiden.se:5000/pdnsadmin:20210925" already present on machine
  Normal   Created           39m   kubelet            Created container pdnsadmin
  Normal   Started           39m   kubelet            Started container pdnsadmin

Obviously “Successfully assigned default/pdnsadmin-deployment-856dcfdfd8-vmzws to kube01.svealiden.se” was a good thing but Kubernetes telling me that zero nodes were initially available? When the only requirement I set out was that pdns-admin-gui pods shouldn’t be run on the same node? And there are three nodes? And I asked for three pods? That’s the sort of stuff that would make me very nervous if this was used for production. What if Kubernetes gets stuck in the “All pods forbidden because reasons”-mode?

This is also why I’m terrified of running Ceph for production applications. Multiple independent Ceph cluster? Okey, now we’re talking but a single cluster? It’s just a matter of time before Ceph locks up on you and you have a week’s downtime while trying to figure out what the hell is going on.

The keen observer will ask “Aren’t you a massive fan of clusters?” and that’s entirely correct. I’ve run Ceph for my own applications for just over two years and have Elasticsearch, MongoDB and MariaDB clusters set up. But the key point is disaster recovery. Clusters can be great for high availability which is what I’m really a fan of but clusters where there isn’t an override in case the complex logic of the distributed system goes on the fritz are a huge gamble. If MongoDB gets confused I can choose a node and force it to become the primary. If I can get the others to join afterwards that’s fine, otherwise I’ll just have to blank them and rebuild. Same with MariaDB, I can kill the two nodes and make the remaining one a master and take it from there. I don’t need any distributed algorithm to give me permission to bring systems back in a diminished capacity.

By the way, nothing essential runs on my Ceph cluster. Recursive DNS servers, file-shares, backup of file-shares and so on are all running on local storage in a multimaster or master/slave configuration. Ceph going down will disable some convience-functions, my Zabbix monitoring server, Prometheus, Grafana and so on, but I can live without them for a couple of hours while I swear angrily at Ceph. In fairness I haven’t had a serious Ceph-issue now for (checking…) about a year now!

containerd doesn’t support pull-through-cache

This means that microk8s(which is awesome!) doesn’t support fetching data through pull-through-caches. I’ve read that later versions of containerd does support it but that’s not what microk8s is running in that case. Oh well, now I’ve set my private registry to not be a pull-through-cache because it can’t be that and an ordinary private registry. So now I pull images, tag them with my local registry as the source and push them there:

cjp@amd:~$ docker tag nginx cacher.svealiden.se:5000/nginx:20210925
cjp@amd:~$ docker push cacher.svealiden.se:5000/nginx:20210925
The push refers to repository [cacher.svealiden.se:5000/nginx]
fac15b2caa0c: Pushed
f8bf5746ac5a: Pushed
d11eedadbd34: Pushed
797e583d8c50: Pushed
bf9ce92e8516: Pushed
d000633a5681: Mounted from redis
20210925: digest: sha256:6fe11397c34b973f3c957f0da22b09b7f11a4802e1db47aef54c29e2813cc125 size: 157

Then microk8s can pull them. Maybe this would have gone more quickly without that drink three hours ago?

InnoDB compression and replication

I wrote a backup tool initially called… (looking in files) OffsiteJ because it was an offsite backup tool I made in Java. Then it was called OffsiteBackup and now just backuptool. It’s a great example of how maybe you shouldn’t put of optimization too long. It uses gigabytes of RAM to run and used as much as 5GB of database disk at one point and it basically just handles my own files. Admittedly, that’s like 2 TB of data but I think it could be waay more efficient if not implemented naïvely using Java with Hibernate ORM. But I’ll stick with it for a while yet.

As I switched to a new database cluster I needed to import the associated database and I figured I’d use page compression to make the database smaller. I had already marked the biggest table as using compression:

CREATE TABLE `FileObservation` (
  `id` bigint(20) NOT NULL AUTO_INCREMENT,
  `hashsum` varchar(255) DEFAULT NULL,
  `mtime` datetime(6) DEFAULT NULL,
  `path` varchar(2000) DEFAULT NULL,
  `size` bigint(20) DEFAULT NULL,
  `indexJob_id` bigint(20) DEFAULT NULL,
  PRIMARY KEY (`id`),
  KEY `FKsixox7stuy7q7e3rln32ymn2j` (`indexJob_id`),
  CONSTRAINT `FKsixox7stuy7q7e3rln32ymn2j` FOREIGN KEY (`indexJob_id`) REFERENCES `IndexJob` (`id`)
) ENGINE=InnoDB AUTO_INCREMENT=17966253 DEFAULT CHARSET=utf8mb4 `PAGE_COMPRESSED`=1;

Mmmm, 17 966 253 file observations… Efficient…

Everything in MariaDB was set up by default already so the only thing I changed was to use lzma instead of zlib as a compression algorithm:

SET GLOBAL innodb_compression_algorithm='lzma';

I had to run this on all three nodes, this is not a setting that spreads via replication like CREATE USER or DROP DATABASE. I also set it in the conf-file for each server so that the same setting is present after a restart. All of this was done on a live setup used for my monitoring service first and foremost so I didn’t want to restart things if it could be avoided. (I say about my HA database cluster that exist precisely so that restarting individual nodes isn’t noticeable)

Anyway… It took a long time to do the import but now the database only needs 1.7GB of space!

[root@pacemaker02 ~]# du -sh /var/lib/mysql/data/backuptool/
1.7G /var/lib/mysql/data/backuptool/

It’s probably going to be really slow to read and write from but hey, this is largely for testing purposes. If backuptool becomes entirely unusuable I guess it’s time for me to do the sensible thing and switch back to duplicity. The number one idea of backuptool is that it requires no special tools to restore backups. It’s easier if you have the database if you want to restore a specific file but in a disaster recovery scenario you only need access to the S3-bucket, gpg and tar.

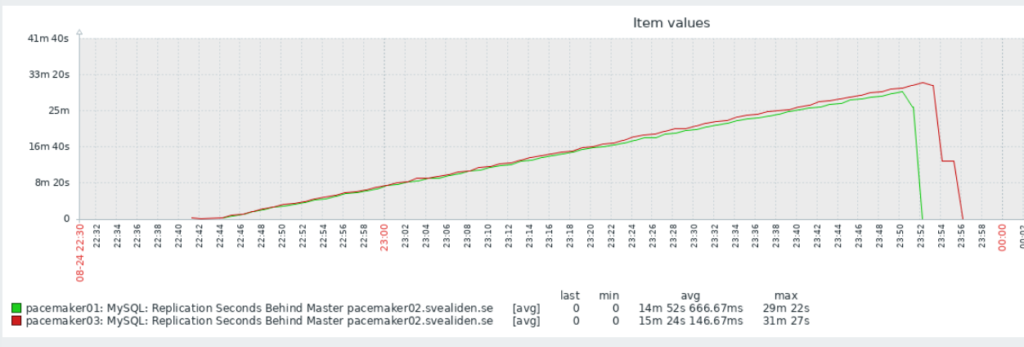
It was interesting to see the slave nodes in the MariaDB cluster struggle to keep up with the more powerful master:

I can’t quite figure out why it dropped so fast at the end though. I expected it to drop at about the same angle only downwards once it reached its peak. But this is partly why I do unnecessary stuff, to see what unexpected things happen!

Galera to pacemaker switch

So I know in theory how to switch a database from one MariaDB server to another with extremely little downtime. It turns out to be trickier than I had thought in reality when the source is a Galera cluster but let’s go through it step by step:

Step 1

Choose a Galera node and make sure it has binary logging activated and log_slaves_updates = ON. Otherwise it won’t log things in a manner that can be sent to a slave that isn’t a Galera node and the log_slaves_updates-thing is to make it actually do send updates to the slave. I added log_slave_updates = ON to the slave as well because it’s not entirely clear how updates from the Galera node is viewed. I mean, in a sense all Galera nodes are both slaves and masters…

Also make sure the server id of the target node(temporary slave) doesn’t match any of the Galera nodes. Otherwise any Galera node will think that server_id = 1 is already caught up! That took me a couple of hours to figure out.

Step 2

Dump the database to be transferred from the Galera node you chose earlier:

mysqldump --single-transaction --master-data=1 --triggers --events --routines zabbix > zabbix.sql

Copy it to the target server.

Step 3

Create the necessary users and an empty database on the target server and then import the SQL-dump.

mysql zabbix < zabbix.sql

Step 4

Extract the replication coordinates from the top of the sql dump:

root@cluster3:~# head -30 zabbix.sql | grep MASTER
CHANGE MASTER TO MASTER_LOG_FILE='mysql-bin.000150', MASTER_LOG_POS=691605499;

Create an SQL-file with the full information required to start streaming updates from the Galera node using this data:

CHANGE MASTER TO MASTER_HOST='cluster3.svealiden.se', MASTER_PORT=3306, MASTER_USER="replication_user", MASTER_PASSWORD="SECRETREPLICATIONPASSWORD", MASTER_LOG_FILE='mysql-bin.000150', MASTER_LOG_POS=691605499;
SET GLOBAL replicate_do_db='zabbix';
START SLAVE;

The SET GLOBAL replicate_do_db=’zabbix’; thing is for situations where there is just one database that you want to bring from a source that has multiple databases.

Step 5

Wait for slave to catch up:

MariaDB [(none)]> SHOW SLAVE STATUS\G 
*************************** 1. row ***************************               
                Slave_IO_State: Waiting for master to send event  
                   Master_Host: cluster3.svealiden.se         
                   Master_User: replication_user                             
                   Master_Port: 3306                                         
                 Connect_Retry: 60                                           
               Master_Log_File: mysql-bin.000150
           Read_Master_Log_Pos: 797684680                                    
                Relay_Log_File: pacemaker01-relay-bin.000002
                 Relay_Log_Pos: 10010385                                     
         Relay_Master_Log_File: mysql-bin.000150
              Slave_IO_Running: Yes                                          
             Slave_SQL_Running: Yes
               Replicate_Do_DB: zabbix                                                                                                                    
           Replicate_Ignore_DB: 
            Replicate_Do_Table:                                              
        Replicate_Ignore_Table:      
       Replicate_Wild_Do_Table: 
   Replicate_Wild_Ignore_Table:                                              
                    Last_Errno: 0    
                    Last_Error: 
                  Skip_Counter: 0                                            
           Exec_Master_Log_Pos: 707563585                                                                                                                 
               Relay_Log_Space: 66709818                                                                                                                  
               Until_Condition: None                                         
                Until_Log_File:                                              
                 Until_Log_Pos: 0                                                                                                                                     Master_SSL_Allowed: No                                           
            Master_SSL_CA_File:       
            Master_SSL_CA_Path:                                              
               Master_SSL_Cert: 
             Master_SSL_Cipher:                                              
                Master_SSL_Key:                                              
         Seconds_Behind_Master: 21398

Note the Seconds_Behind_Master-part that tells you how far the slave has been able to catch up. As you get close to zero, get ready to stop writing data to the Galera cluster.

Step 6

Stop writing data to Galera. In my case this entailed changing two configuration files for Zabbix(zabbix-server and the Zabbix Web UI) and stopping the associated services.

root@monitor:~# systemctl stop zabbix-server && systemctl stop nginx

Then stop replicating data from the Galera cluster. Since I had set the slave to read_only mode I had to disable that as well:

MariaDB [(none)]> STOP SLAVE;
Query OK, 0 rows affected (0.014 sec)

MariaDB [(none)]> SET GLOBAL read_only = false;
Query OK, 0 rows affected (0.001 sec)

Then just start up the services now that they have been told to contact the new database server.

root@monitor:~# systemctl start zabbix-server && systemctl start nginx

Can you spot where the switch happened?

Can you spot where the two failed attempts at making this switch seamlessly happened?

Sidenote: this is an example of a sentence that would stand to gain from English having more syntactic options. Like Can you spot where the two failed attempts at making this switch seamlessly happened. Here it’s more clear that we are talking about X = making a switch seamlessly and how there were two failed attempts at making X happen. Compare that to the more nonsensical Can you spot where the two failed attempts at making this switch seamlessly happened. No, we’re not talking about failures seemlessly happening, the switch was supposed to be seemless.

So anyway… Seconds_Behind_Master is a great piece of data to read when you’re about to switch over to a replica that you think is caught up.

Use cases

This is useful for a lot of situations. Maybe you want to convert a 180GB database from MyISAM to InnoDB? Maybe you need to perform an upgrade where it’s safest to do a mysqldump->import?

The lower limit for how fast this switchover can be is the replication lag. If the slave is always 10 seconds behind, that is the absolute lowest limit for how fast you can make the switch. If you do all the steps manually that adds maybe 20 seconds. Script it and we’re down to a adding a few seconds on top of the replication lag. Short of banks and amazon.com, downtime measured in seconds(maybe multiples of ten seconds) isn’t a cause for great concern.

Oopsies

The tool for removing unused blocks in a filesystem is called fstrim. NOT blkdiscard. That tool discards ALL blocks. Don’t ask me how I came to discover this.

PowerDNS DNSSEC

Add DNSKEY-record to a zone in PowerDNS:

root@authdns01:~# pdnsutil secure-zone deref                                        
Securing zone with default key size                                                                                                                                      
Adding CSK (257) with algorithm ecdsa256                                            
Zone deref secured                                                                                                                                                       
Adding NSEC ordering information

Then we can try to sign a subdomain:

root@authdns01:~$ pdnsutil secure-zone svealiden.deref
Securing zone with default key size
Adding CSK (257) with algorithm ecdsa256
Zone svealiden.deref secured
Adding NSEC ordering information

Let’s check the DNSKEY of both:

root@authdns01:~# dig +short deref dnskey @192.168.1.71
257 3 13 s4PVoj6Zcg+cV36sjhO5YazfXABOtw4XcphhRZG94dqjokGBZf2y450v hDBGH69NVp7oN6Cdq/RJyJIzEQJOQQ==
root@authdns01:~# dig +short svealiden.deref dnskey @192.168.1.71
257 3 13 KYnKZmELQgIKrevye+b2Wmv+6Gw89Uvu2Hlox+0+uWH9gPnVOdQOfKB1 UmayuLrqdLnp8UoneL2tAHCU0uLimA==

All righty. So far so good. Let’s make sure we have RRSIG for stuff:

root@authdns01:~# dig deref ns +dnssec @192.168.1.71

;; QUESTION SECTION:
;deref.                         IN      NS

;; AUTHORITY SECTION:
deref.                  3600    IN      SOA     ns.svealiden.se. cjp.deref.se. 2021072502 10800 3600 604800 3600
deref.                  3600    IN      RRSIG   SOA 13 1 3600 20210805000000 20210715000000 10485 deref. MPfYev987qD2PE0L5HRDfXabDhKDbCPBwtAaGVtr5Kw+ibKb4AEn3Rjv cQ2um+qPoKOaTeN7pJ4q/dmK7ybwvw==
deref.                  3600    IN      NSEC    svealiden.deref. SOA RRSIG NSEC DNSKEY
deref.                  3600    IN      RRSIG   NSEC 13 1 3600 20210805000000 20210715000000 10485 deref. 81joG7RSmkAU/N6jLg+QG4UrW1oUc/ojNzcuGiQbC9LGIZFggrzlGdw8 ldiwUI6JSthtbpCuLyFRiGi9ad1YuQ==

Okey, the same for svealiden.deref?

root@authdns01:~# dig svealiden.deref ns +dnssec @192.168.1.71

;; QUESTION SECTION:
;svealiden.deref.               IN      NS

;; AUTHORITY SECTION:
svealiden.deref.        3600    IN      SOA     ns.svealiden.se. cjp.deref.se. 2021072501 10800 120 604800 3600
svealiden.deref.        3600    IN      RRSIG   SOA 13 2 3600 20210805000000 20210715000000 24037 svealiden.deref. OMgnE5XpmMsaMb3zMVhEgDJdyAm34W2sTH94YqhsAeDswJkZA2fmmkFd uWtKPXY65RmLqplKxlTXpLZxt3c0Hw==
svealiden.deref.        3600    IN      NSEC    svealiden.deref. A SOA MX RRSIG NSEC DNSKEY
svealiden.deref.        3600    IN      RRSIG   NSEC 13 2 3600 20210805000000 20210715000000 24037 svealiden.deref. lY1BRtNWm48ssKw+QQq3NZI8adUm+hHdsj1OqQIQRL3FkdP1PJ7kXrmH 1q1hqVZkaoJFpkgX10rqxFym4mVwoA==

So could I get the private key behind both the TLD and the subdomain?

root@authdns01:~# pdnsutil export-zone-key deref 1
Private-key-format: v1.2
Algorithm: 13 (ECDSAP256SHA256)
PrivateKey: EH+Vz8ySECRETSECRETSECRETQcDFbooSw=

So far so good. Couldn’t figure out which key ID svealiden.deref used but this helped:

root@authdns01:~# pdnsutil list-keys svealiden.deref
Zone                          Type    Size    Algorithm    ID   Location    Keytag
----------------------------------------------------------------------------------
svealiden.deref               CSK     256     ECDSAP256SHA256 4    cryptokeys  24037

root@authdns01:~# pdnsutil export-zone-key svealiden.deref 4
Private-key-format: v1.2
Algorithm: 13 (ECDSAP256SHA256)
PrivateKey: 5gSqJikSECRETSECRETSECRETqEL+x1mM=

Well this was all nice and well but I was kind of hoping I could do this more manually. Like generating a ZSK, then a KSK and so on. I’ll have to see which tools I could use to do that. Just as a learning exercise. Well at least now I can enable DNSSEC for my own local TLD.

ProxySQL for MariaDB master/slave

I’ve set up a Pacemaker cluster with MariaDB and fence_pve so that we have 1 writeable master and 2 read-only slaves. But writes are not made to either of them directly, instead all queries are routed through ProxySQL and it distributes queries across the three nodes. I first didn’t understand why the developers of ProxySQL advised against a pure read/write split of queries. Surely we don’t want SELECTs to go to the writeable node? It’s busy with INSERTs and UPDATEs. But now I get it; it’s an issue of replication lag. If a client makes an INSERT and then shortly thereafter a SELECT that needs to display the changes that were just made, things can fall apart if the SELECT goes to a slave that hasn’t received the changes from the master yet. So we only want to send queries that we know aren’t millisecond-sensitive to slaves. Well, the replication lag sets the time element… If your slaves are five seconds behind the master then you should only send queries that can tolerate a five second discrepancy to the slaves.

Update 2021-07-30: I realized it was waaaay better to set read-only=1 in the conf files for MariaDB to avoid situations where proxysql accidentally sends INSERT-operations to a non-master because it happens to start out read-write.

Aaaanyway… So installing ProxySQL is pretty much fire-and-forget so the interesting thing is how to feed it the right data. I let each server in the cluster run ProxySQL and whichever node happens to host the master-instance of MariaDB also gets to route the traffic. You could let one of the slaves host the active ProxySQL instance but this was easier for me to implement. Here’s a diagram of how things work:

The dashed lines indicate replication of data and the solid lines represent database queries. The ellipse shows where the virtual IP for the database cluster is located(always on the master node). So with thus setup I can use the exact same config for all three ProxySQL instances, which I’ve turned into a single SQL-file proxyinit.sql:

INSERT INTO mysql_servers(hostgroup_id,hostname,port) VALUES (1,'192.168.1.181',3306);
INSERT INTO mysql_servers(hostgroup_id,hostname,port) VALUES (1,'192.168.1.182',3306);
INSERT INTO mysql_servers(hostgroup_id,hostname,port) VALUES (1,'192.168.1.183',3306);

-- Since hostgroup 0 is the default it makes sense to make it the writer hostgroup
-- To avoid a situation where INSERTs are accidentally sent to a read-only node
INSERT INTO mysql_replication_hostgroups (writer_hostgroup,reader_hostgroup,comment) VALUES (0,1,'cluster1');

-- These are two queries I've identified that take more time than usual and are safe to run on replicas
INSERT INTO mysql_query_rules (rule_id,active,digest,destination_hostgroup,apply) VALUES (1,1,'0xA1D7DC02F2B414BB',1,1);
INSERT INTO mysql_query_rules (rule_id,active,digest,destination_hostgroup,apply) VALUES (2,1,'0x112A8E68C94FFE30',1,1);

-- By default all queries should go to the master so default hostgroup should be 0
INSERT INTO mysql_users(username,password,default_hostgroup) VALUES ('zabbix','MYZABBIXPASSWORD',0);

-- Now we have to load our data into the active runtime
LOAD MYSQL USERS TO RUNTIME;
LOAD MYSQL SERVERS TO RUNTIME;
LOAD MYSQL QUERY RULES TO RUNTIME;

-- And I don't want to have to enter this data all the time so better save it to disk
SAVE MYSQL USERS TO DISK;
SAVE MYSQL SERVERS TO DISK;
SAVE MYSQL QUERY RULES TO DISK;

To load this into each ProxySQL instance I just run:

mysql -u admin -pMYADMINPASSWORD -h 0.0.0.0 -P6032 < proxyinit.sql

Testing

Let’s try to take pcmk2 out of the cluster so that some other node has to take over the role of primary:

[root@pcmk2 ~]# pcs resource
  * db_primary_ip       (ocf::heartbeat:IPaddr2):        Started pcmk2.svealiden.se
  * Clone Set: mariadb_server-clone [mariadb_server] (promotable):
    * Masters: [ pcmk2.svealiden.se ]
    * Slaves: [ pcmk1.svealiden.se pcmk3.svealiden.se ]
[root@pcmk2 ~]# pcs cluster stop
Stopping Cluster (pacemaker)...
Stopping Cluster (corosync)...
[root@pcmk2 ~]# 

Okey, let’s see who is the new master.

[root@pcmk1 ~]# pcs resource
  * db_primary_ip       (ocf::heartbeat:IPaddr2):        Started pcmk1.svealiden.se
  * Clone Set: mariadb_server-clone [mariadb_server] (promotable):
    * Masters: [ pcmk1.svealiden.se ]
    * Slaves: [ pcmk3.svealiden.se ]
    * Stopped: [ pcmk2.svealiden.se ]

Okey, pcmk1. Let’s see if we see writes being made from ProxySQL to pcmk1:

[root@pcmk1 ~]# tcpdump -nnX -i lo port 3306 | grep -i insert
 dropped privs to tcpdump
 tcpdump: verbose output suppressed, use -v[v]… for full protocol decode
 listening on lo, link-type EN10MB (Ethernet), snapshot length 262144 bytes
         0x0030:  54af e6dc 9500 0000 0369 6e73 6572 7420  T……..insert.
         0x0030:  54af e31e 4d01 0000 0369 6e73 6572 7420  T…M….insert.
         0x0030:  54af e83e 8302 0000 0369 6e73 6572 7420  T..>…..insert.
         0x0030:  54af ee9f 1b01 0000 0369 6e73 6572 7420  T……..insert.
         0x0030:  54af f287 5401 0000 0369 6e73 6572 7420  T…T….insert.
         0x0030:  54af eac0 ff01 0000 0369 6e73 6572 7420  T……..insert.
         0x0030:  54af f3f9 1601 0000 0369 6e73 6572 7420  T……..insert.
         0x0030:  54af eabc a900 0000 0369 6e73 6572 7420  T……..insert.
         0x0030:  54af f29f c301 0000 0369 6e73 6572 7420  T……..insert.
         0x0030:  54af f6b0 a501 0000 0369 6e73 6572 7420  T……..insert.
         0x0030:  54af fa9b 0b02 0000 0369 6e73 6572 7420  T……..insert.

Seems about right. We can check that ProxySQL correctly identifies pcmk1 as master now:

ProxySQL Admin> SELECT hostgroup_id,hostname,status FROM mysql_servers;
+--------------+---------------+--------+
| hostgroup_id | hostname      | status |
+--------------+---------------+--------+
| 0            | 192.168.1.181 | ONLINE | <-- Yes, pcmk1 is the only writable node
| 1            | 192.168.1.183 | ONLINE |
| 1            | 192.168.1.182 | ONLINE |
| 1            | 192.168.1.181 | ONLINE |
+--------------+---------------+--------+
4 rows in set (0.001 sec)

Let’s see what happens when I bring pcmk2 back up again. It should be a slave.

[root@pcmk1 ~]# pcs resource
  * db_primary_ip       (ocf::heartbeat:IPaddr2):        Started pcmk1.svealiden.se
  * Clone Set: mariadb_server-clone [mariadb_server] (promotable):
    * mariadb_server    (ocf::heartbeat:mariadb):        Starting pcmk2.svealiden.se
    * Masters: [ pcmk1.svealiden.se ]
    * Slaves: [ pcmk3.svealiden.se ]
[root@pcmk1 ~]# pcs resource
  * db_primary_ip       (ocf::heartbeat:IPaddr2):        Started pcmk1.svealiden.se
  * Clone Set: mariadb_server-clone [mariadb_server] (promotable):
    * Masters: [ pcmk1.svealiden.se ]
    * Slaves: [ pcmk2.svealiden.se pcmk3.svealiden.se ]

So far so good. Let’s just double-check to see that pcmk2 isn’t out of sync and emitting errors:

MariaDB [(none)]> SHOW SLAVE STATUS\G
*************************** 1. row ***************************
                Slave_IO_State: Waiting for master to send event
                   Master_Host: pcmk1
                   Master_User: replication_user
                   Master_Port: 3306
                 Connect_Retry: 60
               Master_Log_File: pcmk1-bin.000005
           Read_Master_Log_Pos: 931920
                Relay_Log_File: pcmk2-relay-bin.000002
                 Relay_Log_Pos: 932262
         Relay_Master_Log_File: pcmk1-bin.000005
              Slave_IO_Running: Yes
             Slave_SQL_Running: Yes
               Replicate_Do_DB:
           Replicate_Ignore_DB:
            Replicate_Do_Table:
        Replicate_Ignore_Table:
       Replicate_Wild_Do_Table:
   Replicate_Wild_Ignore_Table:
                    Last_Errno: 0
                    Last_Error:
                  Skip_Counter: 0
           Exec_Master_Log_Pos: 931920
               Relay_Log_Space: 932571
               Until_Condition: None
                Until_Log_File:
                 Until_Log_Pos: 0
            Master_SSL_Allowed: No
            Master_SSL_CA_File:
            Master_SSL_CA_Path:
               Master_SSL_Cert:
             Master_SSL_Cipher:
                Master_SSL_Key:
         Seconds_Behind_Master: 0
 Master_SSL_Verify_Server_Cert: No
                 Last_IO_Errno: 0
                 Last_IO_Error:
                Last_SQL_Errno: 0
                Last_SQL_Error:
   Replicate_Ignore_Server_Ids:
              Master_Server_Id: 1
                Master_SSL_Crl:
            Master_SSL_Crlpath:
                    Using_Gtid: Current_Pos
                   Gtid_IO_Pos: 0-1-309263
       Replicate_Do_Domain_Ids:
   Replicate_Ignore_Domain_Ids:
                 Parallel_Mode: optimistic
                     SQL_Delay: 0
           SQL_Remaining_Delay: NULL
       Slave_SQL_Running_State: Slave has read all relay log; waiting for more updates
              Slave_DDL_Groups: 0
Slave_Non_Transactional_Groups: 0
    Slave_Transactional_Groups: 1512
1 row in set (0.000 sec)

All good!

Purpose

I think this is pretty attractive as a way of merging high-availability with load balancing. I started tinkering with this when fiddling with Kubernetes and WordPress. No point in having multiple pods spread out over multiple servers if you can’t run multiple database-instances. Well, not in my book anyway. So we’re left to choose between Galera multi-master or the more traditional master-slave setup. There are constraints placed on what can be run in Galera(like a hard primary key requirement) so I think master-slave is more reliable when you yourself might not have complete control over database schemas. ProxySQL would work just fine with Galera too but I wanted to test out the slightly more challenging setup.

A big downside to ProxySQL is that it doesn’t do pass-through authentication. So user added to MariaDB and any user password changed would also need to be made to all ProxySQL instances. That’s fine when the setup is meant for a large WordPress webshop which has one(1) database user that you as an admin manage but for a shared hosting setup it’s a nightmare.

MariaDB MaxScale is an alternative to ProxySQL that solves the issue of replication lag using some fancy footwork and therefore claims to be able to do read/write split automagically and it offers pass-through authentication. Not sure if it has the fancy statistics function that ProxySQL has though.

Behind the scenes

I had to have data to test out this setup and that’s not trivial. Lots of data is sent to my Galera-cluster from Zabbix though… Hmm… Can’t ProxySQL do data mirroring? Indeed it can! First we need to add both the usual database cluster virtual IP and the new testing-cluster’s virtual IP as separate hostgroups:

ProxySQL Admin> SELECT hostgroup_id,hostname,port,status FROM mysql_servers;
+--------------+---------------+------+--------+
| hostgroup_id | hostname      | port | status |
+--------------+---------------+------+--------+
| 0            | 192.168.1.62  | 3306 | ONLINE |
| 1            | 192.168.1.180 | 6033 | ONLINE |
+--------------+---------------+------+--------+
2 rows in set (0.000 sec)

And then a query rule that sends all traffic for the zabbix-user to both hostgroups(not load-balanced, every query goes to both):

ProxySQL Admin> SELECT rule_id,active,username,destination_hostgroup,mirror_hostgroup,apply FROM mysql_query_rules;
+---------+--------+----------+-----------------------+------------------+-------+
| rule_id | active | username | destination_hostgroup | mirror_hostgroup | apply |
+---------+--------+----------+-----------------------+------------------+-------+
| 1       | 1      | zabbix   | 0                     | 1                | 1     |
+---------+--------+----------+-----------------------+------------------+-------+
1 row in set (0.000 sec)

Pacemaker for MariaDB

It’s been two days now and I feel like this lady (from an interesting article at cnet who are apparently still in business). But now I got a MariaDB master-slave cluster set up through pacemaker. I thought it was going to be a breeze since I wrote down how to do it for MySQL 5.7 on this very website! But no…

First off, the resource agent which worked for MySQL 5.7 does _not_ seem to work for MariaDB 10.x. And pulling in the latest scripts from the clusterlabs Github repo into the correct folder in an Ubuntu 20.04-install is bananas. So I abandoned my dear testbench and installed Fedora 33 because their resource-agents package seemed to contain the right stuff. And they do!

But the documentation has some catching up to do. For my three nodes pacemaker01, pacemaker02, pacemaker03 the following sets up the cluster correctly once I set the same password for the hacluster-user on all nodes:

pcs host auth pacemaker01 pacemaker02 pacemaker03
pcs cluster setup mariaha pacemaker01 pacemaker02 pacemaker03

Note that this either requires that the hostnames can be resolved to the correct IPs on all three nodes. I did this through /etc/hosts since it’s a testbench.

You’ll also need these packages:

yum install pacemaker pacemaker-cli mariadb-server

Here’s my MariaDB conf file for pacemaker01:

[mariadb]
log-bin
server_id=1
log-basename=pacemaker01
binlog-format=mixed
expire_logs_days=2
relay_log_purge=0 # I want relay logs in case I need to debug duplicate entries etc.
relay_log_space_limit=1094967295 # But only like 1 GB of relay logs.
read-only=1 # Best to start in read-only mode by default to avoid duplicate entries accidents

I got some weird synchronization errors when the mysql-database was included in the replication so I tried locking replication down to this one database “sysbench”. log_bin=something is important for binary logging to be enabled and that’s a prerequisuite for replication. Obviously server_id needs to be unique to each server and pacemaker01 is replaced by the hostname of the other two servers in their conf-file.

pcs cluster cib mariadb_cfg
pcs -f mariadb_cfg resource create db_primary_ip ocf:heartbeat:IPaddr2 ip=192.168.1.209 cidr_netmask=21 op monitor interval=30s on-fail=restart
pcs -f mariadb_cfg resource create mariadb_server ocf:heartbeat:mariadb binary="/usr/libexec/mysqld" \
replication_user="replication_user" replication_passwd="randompassword" \
node_list="pacemaker01 pacemaker02 pacemaker03" \
op start timeout=120 interval=0 \
op stop timeout=120 interval=0 \
op promote timeout=120 interval=0 \
op demote timeout=120 interval=0 \
op monitor role=Master timeout=30 interval=10 \
op monitor role=Slave timeout=30 interval=20 \
op notify timeout="60s" interval="0s"
pcs -f mariadb_cfg resource promotable mariadb_server master-max=1 master-node-max=1 clone-max=3 clone-node-max=1 notify=true
pcs -f mariadb_cfg constraint colocation add master mariadb_server-clone with db_primary_ip score=INFINITY
pcs -f mariadb_cfg constraint order promote mariadb_server-clone then db_primary_ip symmetrical=true
pcs cluster cib-push mariadb_cfg

Here’s a nice thing: the command for creating a master-slave setup used to be something like “pcs -f mariadb_cfg resource master mariadb_server master-max=1 master-node-max=1 clone-max=3 clone-node-max=1 notify=true

Yeah, the word master has been replaced by “promotable”. MariaDB are also working to expunge politically incorrect language in case you were wondering. Here was me thinking that slavery was a problem when applied to humans but I guess we’ll just purge these terms no matter what they refer to.

So anyway… What took all sunday was to figure out why pacemaker kept saying that zero nodes participated in the election of a new master. There were clearly three nodes registered as Online in the cluster. After equipping the file /usr/lib/ocf/resource.d/heartbeat/mariadb with some additional debug statements it became clear that the issue was that none of the servers were announcing their gtid_current_pos. Admittedly, that makes it difficult to elect which server is most advanced and should be promoted.

For whatever reason my practice of dumping the master DB like so:

mysqldump --master-data -A > master.sql

is okey but I neglected to consider that Pacemaker assumes that the “gtid_current_pos” value is usable. But this doesn’t get updated until after the replication gets going. So this ended up in the log:

Dec 13 21:14:17 mariadb(mariadb_server)[43240]: INFO: Value to be set as gtid for pacemaker03: 0-1-1
Set r/w permissions for uid=189, gid=189 on /var/log/pacemaker/pacemaker.log
Dec 13 21:14:17 mariadb(mariadb_server)[43240]: INFO: /usr/sbin/attrd_updater -p -N pacemaker03 -n mariadb_server-gtid -Q
Set r/w permissions for uid=189, gid=189 on /var/log/pacemaker/pacemaker.log
Dec 13 21:14:17 mariadb(mariadb_server)[43240]: INFO: Result: name="mariadb_server-gtid" host="pacemaker03" value=""
Set r/w permissions for uid=189, gid=189 on /var/log/pacemaker/pacemaker.log
Dec 13 21:14:17 mariadb(mariadb_server)[43240]: INFO: Query result: name="mariadb_server-gtid" host="pacemaker01" value="0-1-1"
Dec 13 21:14:17 mariadb(mariadb_server)[43240]: INFO: Value in read_gtid: 0-1-1
Set r/w permissions for uid=189, gid=189 on /var/log/pacemaker/pacemaker.log
Dec 13 21:14:17 mariadb(mariadb_server)[43240]: INFO: Query result: name="mariadb_server-gtid" host="pacemaker02" value=""
Dec 13 21:14:17 mariadb(mariadb_server)[43240]: INFO: Value in read_gtid:
Dec 13 21:14:17 mariadb(mariadb_server)[43240]: INFO: No reply from pacemaker02
Set r/w permissions for uid=189, gid=189 on /var/log/pacemaker/pacemaker.log
Dec 13 21:14:17 mariadb(mariadb_server)[43240]: INFO: Query result: name="mariadb_server-gtid" host="pacemaker03" value=""
Dec 13 21:14:17 mariadb(mariadb_server)[43240]: INFO: Value in read_gtid:
Dec 13 21:14:17 mariadb(mariadb_server)[43240]: INFO: No reply from pacemaker03
Dec 13 21:14:17 mariadb(mariadb_server)[43240]: INFO: Not enough nodes (1) contributed to select a master, need 3 nodes.

But by logging in to the slaves and running SET GLOBAL gtid_slave_pos=’0-1-1′; and then “START SLAVE;” did the trick.

A few quick restarts(both pull-the-plug style and orderly) later it seems to work fine. The problem I encountered before was that a master could not rejoin the cluster automatically after it was demoted, even if it was done nicely with “pcs cluster stop pacemaker01“. There would be “Failed to replicate, duplicate entry yada-yada” errors.

Not seeing that now, which is nice! I’ll rewrite my own sysbench script with transactions and “SELECT X FROM Y FOR UPDATE” and things that strain the DB a bit more to work with MariaDB and do some more tests.

Oh, for some reason the ocf:heartbeat:mariadb-script enables semi-synchronous replication for some reason. You might want to edit that segment(search for rpl_semi) if you don’t want that tradeoff.

Update 2021-07-08

Went through this again for some ProxySQL-testing and ended up writing a bash-script for setting up the whole thing with fencing and all:

#!/bin/bash

# Create a virtual IP for the database cluster
pcs -f mariadb_cfg resource create db_primary_ip ocf:heartbeat:IPaddr2 ip=192.168.1.180 cidr_netmask=21 op monitor interval=30s on-fail=restart
# Create the MariaDB clone on all three nodes
pcs -f mariadb_cfg resource create mariadb_server ocf:heartbeat:mariadb binary="/usr/sbin/mysqld" \
replication_user="replication_user" replication_passwd="REPLICATIONPASSWORD" \
node_list="pcmk1.svealiden.se pcmk2.svealiden.se pcmk3.svealiden.se" \
        op start timeout=120 interval=0 \
        op stop timeout=120 interval=0 \
        op promote timeout=120 interval=0 \
        op demote timeout=120 interval=0 \
        op monitor role=Master timeout=30 interval=10 \
        op monitor role=Slave timeout=30 interval=20 \
        op notify timeout="60s" interval="0s"
echo MariaDB Server clone set created

# Indicate that there must only ever be one(1) master among the MariaDB clones
pcs -f mariadb_cfg resource promotable mariadb_server master-max=1 master-node-max=1 clone-max=3 clone-node-max=1 notify=true
# The virtual IP MUST be on the same node as the MariaDB master
pcs -f mariadb_cfg constraint colocation add master mariadb_server-clone with db_primary_ip score=INFINITY
pcs -f mariadb_cfg constraint order promote mariadb_server-clone then db_primary_ip symmetrical=true
echo MariaDB Server clone set constraints set

# Let pcmk1.svealiden.se be fence by the fence_pve agent that needs to connect to
# 192.168.1.21 with the provided credentials to kill VM 139(pcmk1)
pcs -f mariadb_cfg stonith create p_fence_pcmk1 fence_pve \
        ip="192.168.1.21" nodename="pve1.svealiden.se" \
        login="root@pam" password="PROXMOXROOTPASSWORD" plug="139" delay="15" vmtype="qemu" \
        pcmk_host_list="pcmk1.svealiden.se" \
        op monitor interval="60s" \
        meta target-role="Started" is-managed="true"
pcs -f mariadb_cfg stonith create p_fence_pcmk2 fence_pve \
        ip="192.168.1.22" nodename="pve2.svealiden.se" \
        login="root@pam" password="PROXMOXROOTPASSWORD" plug="140" delay="15" vmtype="qemu" \
        pcmk_host_list="pcmk2.svealiden.se" \
        op monitor interval="60s" \
        meta target-role="Started" is-managed="true"
pcs -f mariadb_cfg stonith create p_fence_pcmk3 fence_pve \
        ip="192.168.1.23" nodename="pve3.svealiden.se" \
        login="root@pam" password="PROXMOXROOTPASSWORD" plug="141" delay="15" vmtype="qemu" \
        pcmk_host_list="pcmk3.svealiden.se" \
        op monitor interval="60s" \
        meta target-role="Started" is-managed="true"
echo Fence devices created

# Make sure each fencing device is located away from the node it is supposed to 
# fence. It makes no sense to expect a node to be able to fence itself in the event
# of some malfunction.
pcs -f mariadb_cfg constraint location p_fence_pcmk1 avoids pcmk1.svealiden.se=INFINITY
pcs -f mariadb_cfg constraint location p_fence_pcmk2 avoids pcmk2.svealiden.se=INFINITY
pcs -f mariadb_cfg constraint location p_fence_pcmk3 avoids pcmk3.svealiden.se=INFINITY
echo Fence location constraints added

# Activate fencing
pcs -f mariadb_cfg property set stonith-enabled=true
pcs cluster cib-push mariadb_cfg

Had to increase the rights of the replication_user for some reason(I gave it SUPER for the sake of simplicity).

Oh, a nicer mysqldump variant:

mysqldump -A --single-transaction --gtid --master-data=1 --triggers --events --routines > pcmk2.sql

Update 2021-07-30

pcs cluster move for master doesn’t work in the latest Fedora due to promoted/master inconsistency between crm_resource and pcs. How surprising that changing keywords used to describe specific states causes problems… Anyway, this works:

[root@pcmk2 ~]# crm_resource --move --resource mariadb_server-clone --node pcmk1.svealiden.se --promoted --lifetime=P300S
Migration will take effect until: 2021-07-30 00:38:26 +02:00
[root@pcmk2 ~]# pcs constraint list --full
Location Constraints:
Resource: mariadb_server-clone
Constraint: cli-prefer-mariadb_server-clone
Rule: boolean-op=and score=INFINITY (id:cli-prefer-rule-mariadb_server-clone)
Expression: #uname eq string pcmk1.svealiden.se (id:cli-prefer-expr-mariadb_server-clone)
Expression: date lt 2021-07-30 00:38:26 +02:00 (id:cli-prefer-lifetime-end-mariadb_server-clone)
Resource: p_fence_pcmk1
Disabled on:
Node: pcmk1.svealiden.se (score:-INFINITY) (id:location-p_fence_pcmk1-pcmk1.svealiden.se--INFINITY)
Resource: p_fence_pcmk2
Disabled on:
Node: pcmk2.svealiden.se (score:-INFINITY) (id:location-p_fence_pcmk2-pcmk2.svealiden.se--INFINITY)
Resource: p_fence_pcmk3
Disabled on:
Node: pcmk3.svealiden.se (score:-INFINITY) (id:location-p_fence_pcmk3-pcmk3.svealiden.se--INFINITY)
Ordering Constraints:
promote mariadb_server-clone then start db_primary_ip (kind:Mandatory) (id:order-mariadb_server-clone-db_primary_ip-mandatory)
Colocation Constraints:
mariadb_server-clone with db_primary_ip (score:INFINITY) (rsc-role:Master) (with-rsc-role:Started) (id:colocation-mariadb_server-clone-db_primary_ip-INFINITY)
Ticket Constraints:
[root@pcmk2 ~]# pcs resource
  * db_primary_ip       (ocf::heartbeat:IPaddr2):        Started pcmk1.svealiden.se
  * Clone Set: mariadb_server-clone [mariadb_server] (promotable):
    * Masters: [ pcmk1.svealiden.se ]
    * Slaves: [ pcmk2.svealiden.se pcmk3.svealiden.se ]

Update 2021-08-23

Forgot to include a really fast way of creating a new clone. No need for mysqldump or locking the source DB:

mariabackup -u root --backup --stream=xbstream | ssh NEWSLAVE "mbstream -x -C /var/lib/mysql/data"

Then chown -R mysql: /var/lib/mysql/data and using the output from the mariabackup command

[00] 2021-08-23 20:40:11         ...done
[00] 2021-08-23 20:40:11 Executing FLUSH NO_WRITE_TO_BINLOG ENGINE LOGS...
[00] 2021-08-23 20:40:11 mariabackup: The latest check point (for incremental): '5352582709'
[00] 2021-08-23 20:40:11 >> log scanned up to (5356297811)
mariabackup: Stopping log copying thread
[00] 2021-08-23 20:40:11 >> log scanned up to (5356297811)
[00] 2021-08-23 20:40:11 Executing BACKUP STAGE END
[00] 2021-08-23 20:40:11 All tables unlocked
[00] 2021-08-23 20:40:11 Streaming ib_buffer_pool to <STDOUT>
[00] 2021-08-23 20:40:11         ...done
[00] 2021-08-23 20:40:11 Backup created in directory '/root/xtrabackup_backupfiles/'
[00] 2021-08-23 20:40:11 MySQL binlog position: filename 'pacemaker01-bin.000007', position '968336', GTID of the last change '0-2-59839204,1-1-176656'
[00] 2021-08-23 20:40:11 Streaming backup-my.cnf
[00] 2021-08-23 20:40:11         ...done
[00] 2021-08-23 20:40:11 Streaming xtrabackup_info
[00] 2021-08-23 20:40:11         ...done
[00] 2021-08-23 20:40:11 Redo log (from LSN 5352582709 to 5356297811) was copied.
[00] 2021-08-23 20:40:11 completed OK!

Then log on to the new slave CHANGE MASTER TO MASTER_HOST=’pacemaker01.svealiden.se’, MASTER_USER=’replication_user’, MASTER_PASSWORD=’SECRETREPLICATIONPASSWORD’, MASTER_PORT=6603, MASTER_LOG_FILE=’pacemaker01-bin.000007′, MASTER_LOG_POS=968336;

Update 2021-08-23 – part 2

Running things and promoting and demoting nodes seems to be working fine. Consistency has thus far been maintained, which was otherwise the big issue the last time I ran an MariaDB Pacemaker cluster. read_only = ON in the config file is probably the number one contributor but maybe the dedicated MariaDB resource agent also plays a role.

Update 2021-08-29

New config for setting up fencing:

pcs cluster cib > conf_old
cp conf_old fence_cfg
# Let pacemaker01.svealiden.se be fence by the fence_pve agent that needs to connect to
# 192.168.1.21 with the provided credentials to kill VM 127(pacemaker01.svealiden.se)
pcs -f fence_cfg stonith create p_fence_pacemaker01 fence_pve \
        ip="192.168.1.21" nodename="pve1" \
        login="root@pam" password="PROXMOXPASSWORD" plug="127" delay="15" vmtype="qemu" \
        pcmk_host_check="static-list" pcmk_host_list="pacemaker01.svealiden.se" \
        op monitor interval="60s" \
        meta target-role="Started" is-managed="true"
pcs -f fence_cfg stonith create p_fence_pacemaker02 fence_pve \
        ip="192.168.1.22" nodename="pve2" \
        login="root@pam" password="PROXMOXPASSWORD" plug="128" delay="15" vmtype="qemu" \
        pcmk_host_check="static-list" pcmk_host_list="pacemaker02.svealiden.se" \
        op monitor interval="60s" \
        meta target-role="Started" is-managed="true"
pcs -f fence_cfg stonith create p_fence_pacemaker03 fence_pve \
        ip="192.168.1.23" nodename="pve3" \
        login="root@pam" password="PROXMOXPASSWORD" plug="129" delay="15" vmtype="qemu" \
        pcmk_host_check="static-list" pcmk_host_list="pacemaker03.svealiden.se" \
        op monitor interval="60s" \
        meta target-role="Started" is-managed="true"
echo Fence devices created

# Make sure each fencing device is located away from the node it is supposed to
# fence. It makes no sense to expect a node to be able to fence itself in the event
# of some malfunction.
pcs -f fence_cfg constraint location p_fence_pacemaker01 avoids pacemaker01.svealiden.se=INFINITY
pcs -f fence_cfg constraint location p_fence_pacemaker02 avoids pacemaker02.svealiden.se=INFINITY
pcs -f fence_cfg constraint location p_fence_pacemaker03 avoids pacemaker03.svealiden.se=INFINITY
echo Fence location constraints added

# Activate fencing
pcs cluster cib-push fence_cfg

Super-important details: the part pcmk_host_list=”pacemaker02.svealiden.se” is how Pacemaker figures out which fencing “device” can fence which node. But this is only done if pcmk_host_check=”static-list” . Otherwise Pacemaker tries to figure things out itself which I don’t necessarily object to but I feel more confident putting in the right values myself. Note for instance that my VMs don’t use FQDN names so pacemaker02.svealiden.se is actually called pacemaker02 in Proxmox.

nodename=”pve2″ has to be the correct name of the Proxmox host as the cluster knows it. More specifically, if you don’t provide nodename at all, Proxmox will try to find an SSL-cert under /etc/pve/nodes/pacemaker02.svealiden.se which is just all kinds of wrong:

root@pve3:~# ls -lh /etc/pve/nodes/pacemaker02.svealiden.se
ls: cannot access '/etc/pve/nodes/pacemaker02.svealiden.se': No such file or directory

Note that I might think of pve3 as pve3.svealiden.se but in the Proxmox GUI it’s just pve3. So nodename has to be exactly pve3. I spent a lot of time figuring out why things weren’t working only to find myself here:

Aug 29 21:49:42 pve3 pveproxy[3137968]: '/etc/pve/nodes/pve3.svealiden.se/pve-ssl.pem' does not exist!

So that was fun!

Now to another problem. The mariadb resource agent doesn’t understand gtids that involve more than one gtid domain for the purposes of figuring out which node should be elected master:

Aug 29 22:01:30 pacemaker02 pacemaker-attrd[80247]: notice: Setting mariadb_server-gtid[pacemaker02.svealiden.se]: 0-2-59851595,1-1-1672237 -> 0-2-59851595,1-1-1672310
Aug 29 22:01:30 pacemaker02 mariadb(mariadb_server)[124915]: INFO: Not enough nodes (1) contributed to select a master, need 2 nodes.
Aug 29 22:01:30 pacemaker02 pacemaker-execd[80246]: notice: mariadb_server_monitor_20000[124915] error output [ (standard_in) 1: syntax error ]
Aug 29 22:01:30 pacemaker02 pacemaker-execd[80246]: notice: mariadb_server_monitor_20000[124915] error output [ /usr/lib/ocf/resource.d/heartbeat/mariadb: line 276: [: : integer expression expected ]

Turns out line 276 is a utility function which compares numbers and it’s called by a function that compares gtids and apparently it doesn’t work so well when there are two gtids. So now I need to figure out how to purge the errant domain id. I’m leaning towards shutting down Pacemaker, stopping the slaves, blanking all gtid data from the master and then reinitialize the slaves.

Can I blank all GTID data? Oh, even better! I can blank the domain id I don’t want: https://jira.mariadb.org/browse/MDEV-12012

MariaDB [(none)]> SELECT @@global.gtid_binlog_state;
+--------------------------------------+
| @@global.gtid_binlog_state           |
+--------------------------------------+
| 0-2-59851595,1-1-1678111,1-2-1678300 |
+--------------------------------------+
1 row in set (0.000 sec)

MariaDB [(none)]> SELECT @@global.gtid_binlog_state;
+--------------------------------------+
| @@global.gtid_binlog_state           |
+--------------------------------------+
| 0-2-59851595,1-1-1678111,1-2-1678337 |
+--------------------------------------+
1 row in set (0.000 sec)

MariaDB [(none)]> SELECT @@global.gtid_binlog_state;
+--------------------------------------+
| @@global.gtid_binlog_state           |
+--------------------------------------+
| 0-2-59851595,1-1-1678111,1-2-1678338 |
+--------------------------------------+
1 row in set (0.000 sec)

MariaDB [(none)]> FLUSH BINARY LOGS DELETE_DOMAIN_ID=(0);
Query OK, 0 rows affected (0.029 sec)

MariaDB [(none)]> SELECT @@global.gtid_binlog_state;
+----------------------------+
| @@global.gtid_binlog_state |
+----------------------------+
| 1-1-1678111,1-2-1678626    |
+----------------------------+
1 row in set (0.000 sec)

MariaDB [(none)]> SELECT @@global.gtid_binlog_state;
+----------------------------+
| @@global.gtid_binlog_state |
+----------------------------+
| 1-1-1678111,1-2-1678629    |
+----------------------------+
1 row in set (0.000 sec)

MariaDB [(none)]>

Seems to have worked. Switching on Pacemaker messed up the synchronization but after running good old mariabackup -u root –backup –stream=xbstream | ssh NEWSLAVE “mbstream -x -C /var/lib/mysql/data” got things back into the right groove.