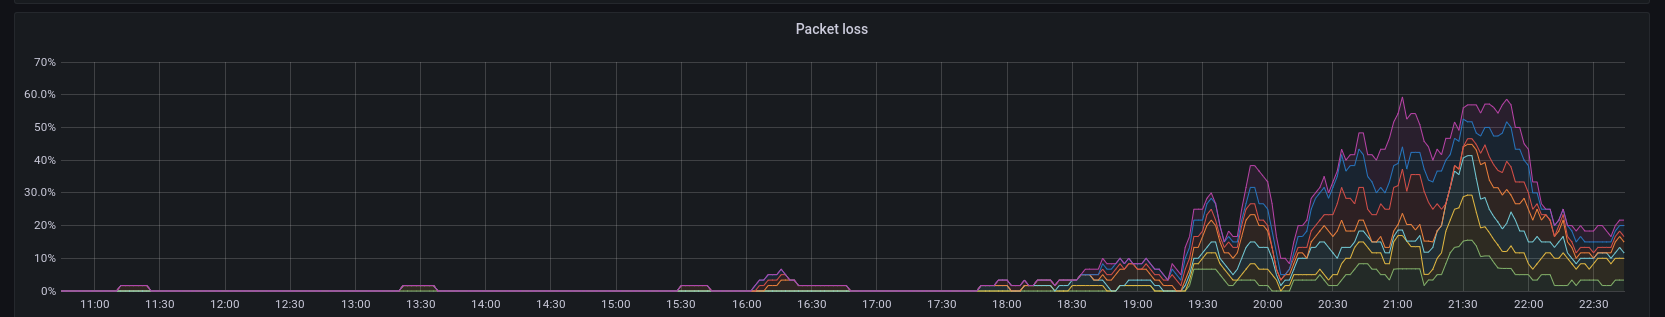
Bahnhof have had a bad couple of weeks around here. Two multi-hour outages and now packetloss has gone crazy.
I suspect however that it’s not their fault. They don’t own the fiber links between each property and the switching stations. Well, I don’t mind packet loss that much when I’m not working. If this keeps up I’ll have to switch over to the 4G backup manually before I start my shift on telephone support. YouTube is very PL-tolerant but VoIP? Not so much. It’s hard enough understanding what people are saying without syllables going missing…
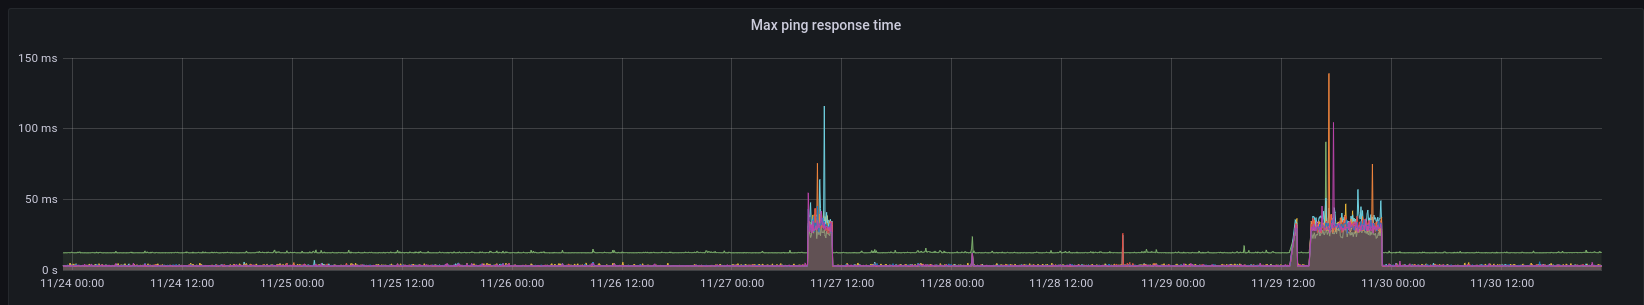
Higher ping on 4G of course but not so high that it interferes with phone calls.
Kube-router is the connection-fabric for pods. So all instances being down is suboptimal. Turns out the file that kube-router needs to connect to Kubernetes couldn’t be found:
[root@kube01 ~]# mkctl logs -f kube-router-lrtxp -n kube-system
I1126 07:44:26.337591       1 version.go:21] Running /usr/local/bin/kube-router version v1.3.2, built on 2021-11-03T18:24:15+0000, go1.16.7
Failed to parse kube-router config: Failed to build configuration from CLI: stat /var/lib/kube-router/client.config: no such file or directory
This was a surprise to me since I hadn’t changed any config. I know because I was asleep! None of this is critical stuff so it’s no biggie but I get kind of curious. Was this a microk8s-thing or a Kubernetes-thing happening? I suspect it’s a microk8s-thing having to do with the path mounted to /var/lib/kube-router/ referencing a specific snap-version of microk8s. Not that I upgraded it while asleep – admittedly – but seems more likely than Kubernetes fiddling with a deployment configuration randomly.
Anyway… Think I’m going to get myself acquainted with Nomad and Consul for a while…
Addendum: Kubernetes is back up and running by the way. I just had to run mkctl edit ds kube-router -n kube-system a couple of times and fiddle some values back and forth.
dnf install dropwatch dropwatch –help dropwatch -l kas dropwatch> start
perf to figure out which software is making calls whose packets are dropped:
dnf install perf -y perf record -g -a -e skb:kfree_skb perf script
Log packets processed in iptables to dmesg:
iptables-legacy -t raw -A PREROUTING -p tcp –dport 9100 -j TRACE dmesg dmesg > dump.txt ls -lh dump.txt iptables-legacy -t raw -D PREROUTING -p tcp –dport 9100 -j TRACE
Still haven’t figured out why Kubernetes keeps dropping packets intermittently on one of three nodes(which one changes are workloads move around). It’s not conntrack being full or the pod receiving the traffic that’s dropping. It just enters ens18 and never enters the correct calico virtual interface so odds are the kernel drops ’em.
I can’t say I’m saddened by this turn of events. This is precisely the sort of stuff that I’ve been ranting about with this kind of “we handle it for you magically” stuff. Great when it works, not so great when you have to trace intermittent packet loss in a patchwork of vxlan and iptables entries managed by shadowy puppetmaster who doesn’t explain himself.
calico-node’s log with logscreenseverity set to debug and filelogging active:
2021-10-16 22:56:43.035 [INFO][8] startup.go 215: Using node name: kube02.svealiden.se
2021-10-16 22:56:43.196 [INFO][17] allocateip.go 144: Current address is still valid, do nothing currentAddr="10.1.173.128" type="vxlanTunnelAddress"
CALICO_NETWORKING_BACKEND is vxlan - no need to run a BGP daemon
Calico node started successfully
That was almost 4 hours ago…
Had a look at Nomad but I’m a little bit skeptical of that too. You seem to need Nomad, Consul and some networking thing to get a useful stack.
root@authdns01:~# pdnsutil secure-zone deref
Securing zone with default key size
Adding CSK (257) with algorithm ecdsa256
Zone deref secured
Adding NSEC ordering information
Then we can try to sign a subdomain:
root@authdns01:~$ pdnsutil secure-zone svealiden.deref
Securing zone with default key size
Adding CSK (257) with algorithm ecdsa256
Zone svealiden.deref secured
Adding NSEC ordering information
Well this was all nice and well but I was kind of hoping I could do this more manually. Like generating a ZSK, then a KSK and so on. I’ll have to see which tools I could use to do that. Just as a learning exercise. Well at least now I can enable DNSSEC for my own local TLD.
Note 1: This assumes you’re familiar with L2 and L3 networking and routing. Ideally you should know more about this stuff than I did when I began this project…
I’ve been trying to learn more about networking and of course my focus is on availability. It’s been pretty standard to use STP(Spanning Tree Protocol) to keep things from going off the rails when connecting switches together in a mesh. The mesh is meant to provide redundancy but that means we get loops that data can travel through and that causes disasters. STP figures out which ports to close to keep loops from happening so we’re all good. If a switch dies STP recalculates its solution and connectivity is maintained.
Except STP and Rapid STP are notoriously moody and go off the rails themselves at times. It’s also complicated by the use of VLANs since two links that may belong to separate VLANs will look equivalent to STP and therefor one of them may be shut off. To this end we must use PVST(Per VLAN Spanning Tree) if we want to use STP and VLANs. Network admins don’t seem to like this approach very much. Just look at the efforts put into finding replacements for STP and it’s variations, like TRILL and SPB.
VXLAN is a popular contribution to this mess but doesn’t really do anything about redundancy in the underlying network. It is however fully compatible with running on a routed IP network. So you could set up your network with a bunch of routers that run OSPF or BGP and then add VXLAN to make your network seem like a set of L2 networks.
Long story made slightly shorter, I thought I’d create a virtual network to test this stuff. OpenVSwitch kicked me hard in the shins by locking up whenever I tried to simulate a link or node going down. Not ideal. I ended up creating lots of bridges on a host to simulate links between routers and servers running as LXC containers.
Setup
AS65128 is a gateway that does NAT because this “data center” is just running inside a virtual machine on a server on my local network. So all these devices must appear like they have an IP-adress in the range used on my local network if they’re going to download data from the internet, like apt install does for instance.
The following script creates and activates the links if need be:
#!/bin/bash

for LNK in $(cat links.txt | cut -d '#' -f 1); do
ip link | awk '{ print $2}' | grep $LNK -q || ip link add $LNK type bridge;
ip link set $LNK up;
done
Config files for all nodes – both which node uses what link and the interface/router config – can be found in the files in this archive: vxlan_conf_rc01.tar.gz
Walk-through
Free Range Routing(FRR) is used throughout to set things up. I had almost no idea what I was doing when setting things up initially, which might explain why this has taken a couple of months. Let’s first look at the routers, like DC01Router01. First we need to enable bgpd in /etc/frr/daemons:
# The watchfrr and zebra daemons are always started.
#
bgpd=yes
ospfd=no
Then we establish that this is a BGP router with AS 65001:
interface lo
ip address 10.0.1.128/32

# DC01GW01
interface eth0
ip address 10.0.1.128 peer 10.0.128.128/32

# DC01Router02
interface eth1
ip address 10.0.1.128 peer 10.0.2.128/32

# DC02Router021
interface eth2
ip address 10.0.1.128 peer 10.0.3.128/32

# DC01Switch01
interface eth3
ip address 10.0.1.128 peer 10.0.1.1/32

# DC01Switch02
interface eth4
ip address 10.0.1.128 peer 10.0.2.1/32

# DC01RR01
interface eth5
ip address 10.0.1.128 peer 10.0.1.129/32

# Any routes not resolved by other means need to be handled by the gateway
ip route 0.0.0.0/0 10.0.128.128 eth0

router bgp 65001 # This is a router in AS65001
  bgp router-id 10.0.1.128 # Its ID is its IP-address
  bgp default ipv4-unicast # Activate IPv4 BGP
  no bgp ebgp-requires-policy # No untrusted routers in use, so we can skip policy
  neighbor 10.0.128.128 remote-as 65128 # Connect to gateway AS65128
  neighbor 10.0.3.128 remote-as 65003 # Connect to DC02 AS65003

  neighbor fabric peer-group # This is a grouping of routers we want to talk to
  neighbor fabric remote-as 65001 # They all belong with AS65001
  neighbor fabric capability extended-nexthop # We might use IPv6 to talk to them
  neighbor fabric next-hop-self all # Offer to route traffic to those who ask
  neighbor 10.0.1.128 peer-group fabric # This node
  neighbor 10.0.2.128 peer-group fabric # DC01Router02
  bgp listen range 10.0.0.0/16 peer-group fabric # Let any 10.0.X.X router connect
  !
  address-family ipv4 unicast
    network 10.0.1.0/24 # We offer access to 10.0.1.X
    network 10.0.2.0/24 # We offer access to 10.0.2.X
    neighbor 10.0.128.128 activate # Connect to gateway
    neighbor fabric activate # Connect to local as routers
  exit-address-family
  !
exit
Some of this stuff are leftovers from a different setup where I tried to let VXLAN BGP information be handled alongside regular IPv4 BGP routing. bgp listen range 10.0.0.0/16 peer-group fabric was meant to make it easy to add new switches to send VXLAN data to the routers but I couldn’t make that work. bgp default ipv4-unicast is the default but I include it for my own sanity.
I’ll let you look through the frr.conf-files for the other routers to see the pattern. If I haven’t made it abundantly clear already: I don’t understand what I’m doing. This is me copy-pasting stuff from tutorials, reading manuals and then brute-forcing stuff until it works. I’m sure there’s more wrong that right with these configs. But it works in my lab environment.
So let’s talk VTEPs! That’s Virtual Terminal End Point I think. Basically a VXLAN “port”. In this setup the switches contain the VTEPs. Currently I only have one VXLAN and I set it up through this script:
ip link del lan100
ip link del vxlan100
ip link add vxlan100 type vxlan id 100 dstport 4789 local 10.0.1.1 nolearning
ip link add lan100 type bridge
ip link set vxlan100 master lan100
ip link set eth2 master lan100
ip link set eth3 master lan100
ip link set vxlan100 up
ip link set lan100 up
eth2 and eth3 are the ports to which the servers connect. The following config on DC01Switch01 sends this information to the Route Reflectors that we will soon take a look at:
router bgp 65127 # Unique AS for VXLAN data
bgp router-id 10.0.1.1 # I call this node a switch but it's really kind of a router
no bgp default ipv4-unicast # Can't figure out how to get VXLAN+IPv4 in one node
neighbor central peer-group # Peer group for Route Reflectors
neighbor central remote-as 65127 # Same AS as this node
neighbor 10.0.3.129 peer-group central # Other RR
neighbor 10.0.1.129 peer-group central # This node
!
address-family l2vpn evpn # Send MAC information
  neighbor central activate # For my peer group
  advertise-all-vni # Send virtual network information
exit-address-family
!
exit
The line address-family l2vpn evpn needs some explanation as it goes to the heart of what this does. l2vpn refers to us setting up a L2 network and somehow this means we also need to establish that this is an ethernet VPN? Basically that stanza says “tell the route reflectors in the peer group central of any MAC-adresses you see related to a VXLAN interface”. That way other switches will know to send a VXLAN packet to your IP-adress whenever someone is trying to send an L2 packet to one of your interfaces.
Let’s look at the FRR conf for DC01RR01 before testing things out:
router bgp 65127 # Special L2VPN-info AS
  bgp router-id 10.0.1.129 # IP of this Route Reflector
  bgp cluster-id 10.0.1.129 # Same, used to manage the fact that there are 2 RR
  no bgp default ipv4-unicast
  neighbor central peer-group
  neighbor central remote-as 65127
  neighbor central capability extended-nexthop
  neighbor 10.0.3.129 peer-group central
  neighbor 10.0.1.129 peer-group central
  bgp listen range 10.0.0.0/16 peer-group central
  !
  address-family l2vpn evpn
   neighbor central activate
   neighbor central route-reflector-client
  exit-address-family
  !
exit
!
The big thing here is that we don’t advertise-all-vni but rather neighbor central route-reflector-client. So switches advertise VNI and L2 data and the Route Reflectors collect this data and provide it to all the switches.
Test
Let’s look at DC01Server02 which has a single IP-adress 10.1.0.102 on eth1(connected to DC01Switch02):
3: eth1@if179: mtu 1500 qdisc noqueue state UP group default qlen 1000
link/ether 8e:bf:63:02:53:9f brd ff:ff:ff:ff:ff:ff link-netnsid 0
inet 10.1.0.102/24 brd 10.1.0.255 scope global eth1
valid_lft forever preferred_lft forever
inet6 fe80::8cbf:63ff:fe02:539f/64 scope link
valid_lft forever preferred_lft forever
Note the hardware address above. Is it visible in DC01Switch01:s Forwarding Database(FDB)?
Nope. Well, no worries. Let’s ping 10.1.0.102 from DC01Server01 with IP-adress 10.1.0.101 which is attached to DC01Switch01:
root@DC01Server01:~# ping 10.1.0.102
PING 10.1.0.102 (10.1.0.102) 56(84) bytes of data.
64 bytes from 10.1.0.102: icmp_seq=1 ttl=64 time=0.165 ms
64 bytes from 10.1.0.102: icmp_seq=2 ttl=64 time=0.181 ms
^C
--- 10.1.0.102 ping statistics ---
2 packets transmitted, 2 received, 0% packet loss, time 1005ms
rtt min/avg/max/mdev = 0.165/0.173/0.181/0.008 ms
That worked just fine. It’s almost as if DC01Switch01 learned the necessary information automatically from the Route Reflectors?
root@DC01Switch01:~# bridge fdb | grep "8e:bf"
8e:bf:63:02:53:9f dev vxlan100 vlan 1 extern_learn master lan100
8e:bf:63:02:53:9f dev vxlan100 extern_learn master lan100
8e:bf:63:02:53:9f dev vxlan100 dst 10.0.2.1 self extern_learn
root@DC01Switch01:~#
Indeed it did! But ICMP ping is a two-way thing. So did DC01Switch02 learn the MAC-adress of DC01Server01?
2: eth0@if176: mtu 1500 qdisc noqueue state UP group default qlen 1000 link/ether ce:d9:c4:af:e6:88 brd ff:ff:ff:ff:ff:ff link-netnsid 0 inet 10.1.0.101/24 brd 10.1.0.255 scope global eth0 valid_lft forever preferred_lft forever inet6 fe80::ccd9:c4ff:feaf:e688/64 scope link valid_lft forever preferred_lft forever
And the FDB on DC01Switch02:
root@DC01Switch02:~# bridge fdb | grep "ce:d9"
ce:d9:c4:af:e6:88 dev vxlan100 vlan 1 extern_learn master lan100
ce:d9:c4:af:e6:88 dev vxlan100 extern_learn master lan100
ce:d9:c4:af:e6:88 dev vxlan100 dst 10.0.1.1 self extern_learn
Success! Let’s try something fancier. Let’s see if we can get DC02Server01 to ping DC01Server02:
root@DC02Server01:~# ping 10.1.0.102
PING 10.1.0.102 (10.1.0.102) 56(84) bytes of data.
64 bytes from 10.1.0.102: icmp_seq=1 ttl=64 time=0.591 ms
64 bytes from 10.1.0.102: icmp_seq=2 ttl=64 time=0.210 ms
64 bytes from 10.1.0.102: icmp_seq=3 ttl=64 time=0.210 ms
64 bytes from 10.1.0.102: icmp_seq=4 ttl=64 time=0.200 ms
^C
--- 10.1.0.102 ping statistics ---
4 packets transmitted, 4 received, 0% packet loss, time 3052ms
rtt min/avg/max/mdev = 0.200/0.302/0.591/0.166 ms
Indeed. So is DC02Switch01 aware of the interfaces connected to the VXLAN interface on DC01Switch02?
root@DC02Switch01:~# bridge fdb | grep "8e:bf"
8e:bf:63:02:53:9f dev vxlan100 vlan 1 extern_learn master lan100
8e:bf:63:02:53:9f dev vxlan100 extern_learn master lan100
8e:bf:63:02:53:9f dev vxlan100 dst 10.0.2.1 self extern_learn
Nicely done. Note that none of these servers know about or have access to 10.0.1.128 or 10.0.1.1 or any of those devices. Not even the switches they are connected to “physically”:
root@DC02Server01:~# ping 10.0.1.2
PING 10.0.1.2 (10.0.1.2) 56(84) bytes of data.
From 10.1.0.103 icmp_seq=1 Destination Host Unreachable
From 10.1.0.103 icmp_seq=2 Destination Host Unreachable
From 10.1.0.103 icmp_seq=3 Destination Host Unreachable
^C
--- 10.0.1.2 ping statistics ---
4 packets transmitted, 0 received, +3 errors, 100% packet loss, time 3066ms
pipe 3
As far as the servers are concerned they are connected to the same switch. They have no way of knowing that the switch is actually four separate switches distributed over two datacenters. Pretty neat! But let’s try some availability-related stuff.
Switching over
Let’s try to ping DC01Server01 from DC02Server02 like before and then tell DC01Server01 to stop using eth0(connected to DC01Switch01) and instead start using eth1 which is connected to DC01Switch02. What does the switch used by DC02Server02 know about DC01Server01 before we start?
root@DC02Switch02:~# bridge fdb | grep "ce:d9"
ce:d9:c4:af:e6:88 dev vxlan100 vlan 1 extern_learn master lan100
ce:d9:c4:af:e6:88 dev vxlan100 extern_learn master lan100
ce:d9:c4:af:e6:88 dev vxlan100 dst 10.0.1.1 self extern_learn
Right, DC01Server01 is reached through DC01Switch01 which has IP-adress 10.0.1.1. Let’s start pinging:
root@DC02Server02:~# ping 10.1.0.101
PING 10.1.0.101 (10.1.0.101) 56(84) bytes of data.
64 bytes from 10.1.0.101: icmp_seq=1 ttl=64 time=0.197 ms
64 bytes from 10.1.0.101: icmp_seq=2 ttl=64 time=0.210 ms
64 bytes from 10.1.0.101: icmp_seq=3 ttl=64 time=0.205 ms
64 bytes from 10.1.0.101: icmp_seq=4 ttl=64 time=0.305 ms
Switching over to eth1 on DC01Server01… Let’s see what happens to the ping. It get’s stuck after ping 26:
64 bytes from 10.1.0.101: icmp_seq=5 ttl=64 time=0.202 ms 64 bytes from 10.1.0.101: icmp_seq=6 ttl=64 time=0.196 ms 64 bytes from 10.1.0.101: icmp_seq=7 ttl=64 time=0.201 ms 64 bytes from 10.1.0.101: icmp_seq=8 ttl=64 time=0.181 ms 64 bytes from 10.1.0.101: icmp_seq=9 ttl=64 time=0.208 ms 64 bytes from 10.1.0.101: icmp_seq=10 ttl=64 time=0.203 ms 64 bytes from 10.1.0.101: icmp_seq=11 ttl=64 time=0.190 ms 64 bytes from 10.1.0.101: icmp_seq=12 ttl=64 time=0.200 ms 64 bytes from 10.1.0.101: icmp_seq=13 ttl=64 time=0.206 ms 64 bytes from 10.1.0.101: icmp_seq=14 ttl=64 time=0.227 ms 64 bytes from 10.1.0.101: icmp_seq=15 ttl=64 time=0.214 ms 64 bytes from 10.1.0.101: icmp_seq=16 ttl=64 time=0.199 ms 64 bytes from 10.1.0.101: icmp_seq=17 ttl=64 time=0.200 ms 64 bytes from 10.1.0.101: icmp_seq=18 ttl=64 time=0.256 ms 64 bytes from 10.1.0.101: icmp_seq=19 ttl=64 time=0.201 ms 64 bytes from 10.1.0.101: icmp_seq=20 ttl=64 time=0.200 ms 64 bytes from 10.1.0.101: icmp_seq=21 ttl=64 time=0.198 ms 64 bytes from 10.1.0.101: icmp_seq=22 ttl=64 time=0.198 ms 64 bytes from 10.1.0.101: icmp_seq=23 ttl=64 time=0.236 ms 64 bytes from 10.1.0.101: icmp_seq=24 ttl=64 time=0.201 ms 64 bytes from 10.1.0.101: icmp_seq=25 ttl=64 time=0.192 ms 64 bytes from 10.1.0.101: icmp_seq=26 ttl=64 time=0.207 ms 64 bytes from 10.1.0.101: icmp_seq=60 ttl=64 time=0.481 ms 64 bytes from 10.1.0.101: icmp_seq=61 ttl=64 time=0.212 ms 64 bytes from 10.1.0.101: icmp_seq=62 ttl=64 time=0.207 ms 64 bytes from 10.1.0.101: icmp_seq=63 ttl=64 time=0.216 ms 64 bytes from 10.1.0.101: icmp_seq=64 ttl=64 time=0.203 ms 64 bytes from 10.1.0.101: icmp_seq=65 ttl=64 time=0.205 ms 64 bytes from 10.1.0.101: icmp_seq=66 ttl=64 time=0.255 ms 64 bytes from 10.1.0.101: icmp_seq=67 ttl=64 time=0.217 ms 64 bytes from 10.1.0.101: icmp_seq=68 ttl=64 time=0.207 ms 64 bytes from 10.1.0.101: icmp_seq=69 ttl=64 time=0.241 ms 64 bytes from 10.1.0.101: icmp_seq=70 ttl=64 time=0.209 ms 64 bytes from 10.1.0.101: icmp_seq=71 ttl=64 time=0.215 ms 64 bytes from 10.1.0.101: icmp_seq=72 ttl=64 time=0.235 ms 64 bytes from 10.1.0.101: icmp_seq=73 ttl=64 time=0.228 ms 64 bytes from 10.1.0.101: icmp_seq=74 ttl=64 time=0.197 ms 64 bytes from 10.1.0.101: icmp_seq=75 ttl=64 time=0.201 ms 64 bytes from 10.1.0.101: icmp_seq=76 ttl=64 time=0.210 ms 64 bytes from 10.1.0.101: icmp_seq=77 ttl=64 time=0.249 ms 64 bytes from 10.1.0.101: icmp_seq=78 ttl=64 time=0.216 ms 64 bytes from 10.1.0.101: icmp_seq=79 ttl=64 time=0.205 ms 64 bytes from 10.1.0.101: icmp_seq=80 ttl=64 time=0.195 ms 64 bytes from 10.1.0.101: icmp_seq=81 ttl=64 time=0.205 ms 64 bytes from 10.1.0.101: icmp_seq=82 ttl=64 time=0.204 ms 64 bytes from 10.1.0.101: icmp_seq=83 ttl=64 time=0.204 ms 64 bytes from 10.1.0.101: icmp_seq=84 ttl=64 time=0.200 ms ^C — 10.1.0.101 ping statistics — 84 packets transmitted, 51 received, 39.2857% packet loss, time 84979ms rtt min/avg/max/mdev = 0.181/0.216/0.481/0.042 ms
You might say that this isn’t very good. We lost plenty of pings! But if we had lost DC01Switch01 and DC01Server01 failed over like this then a brief interruption is to be expected. At the end of the day the network reconfigured itself automatically to restore connectivity.
I suspect this kind of switch-over can be made to happen faster by configuring things differently but I’ll leave it here for now.
Caveats and things I can’t get to work
I tried using active-backup bonding on servers with this setup and it was a disaster with bridges on switches sending packets on the wrong port. Can’t figure out why but I’ll try it again at some point.
It seems like you have to have VTEPs and Route Reflectors on the same AS. I couldn’t get it to work any other way.
FRR says you can have multiple AS:s in a single bgpd process by using Virtual Routing and Forwarding(VRF) but I couldn’t get that to click. Ideally switches would be part of the routers’ AS to get routes easily but whenever I try to run L2VPN in a non-default VRF nothing happens. Maybe the VXLAN interface must be assigned the same VRF?
FRR:s VRRP implementation is awkward so I’d use Keepalived for that purpose to be honest.
Need to find out what’s drawing 10 Mbit/s on my WAN. Thank God I figured out that port mirroring is a thing before constructing that 3 node keepalived cluster idea to make a redundant virtual router through which all traffic would have to go.
Source is port 1 which goes to the router and port 23 is eno4 on pve3. It may have been sufficient to run “ip link set ens19 promisc on” inside the VM that I connected to the correspond bridge in Proxmox and turn off the firewall for the interface. That last bit was a tricky thing because I have no firewall rules in Proxmox. But apparently just having firewalling enabled kicks my plans of pushing all internet-related packets to my testmonitor right in the shins.
Along the way I switched standard Linux bridging for OpenvSwitch. Not sure if that was necessary but this configuration worked:
With Proxmox 7 it was sufficient to turned of firewall and run this command:
brctl setageing vmbr1 0
Some more notes
Linux bridges can have STP support:
root@pve3:~# brctl showstp vmbr0
vmbr0
 bridge id              8000.ac1f6bb1dd89
 designated root        8000.ac1f6bb1dd89
 root port                 0                    path cost                  0
 max age                  20.00                 bridge max age            20.00
 hello time                2.00                 bridge hello time          2.00
 forward delay             0.00                 bridge forward delay       0.00
 ageing time             300.00
 hello timer               0.00                 tcn timer                  0.00
 topology change timer     0.00                 gc timer                  83.72
 flags


bond0 (1)
 port id                8001                    state                forwarding
 designated root        8000.ac1f6bb1dd89       path cost                  4
 designated bridge      8000.ac1f6bb1dd89       message age timer          0.00
 designated port        8001                    forward delay timer        0.00
 designated cost           0                    hold timer                 0.00
 flags

fwpr103p0 (2)
 port id                8002                    state                forwarding
 designated root        8000.ac1f6bb1dd89       path cost                  2
 designated bridge      8000.ac1f6bb1dd89       message age timer          0.00
 designated port        8002                    forward delay timer        0.00
 designated cost           0                    hold timer                 0.00
 flags
I did not know that.
Here’s a really good idea if you have an internal authoritative DNS server for your domain and you use short TTL values so that changes will propagate quickly: DON’T SET THE PDNS SERVICE TO DISABLED. If you are an idiot like me, run this:
systemctl enable pdns
systemctl start pdns
I guess having your authoritative DNS server autostart is good no matter what your TTL values but it got real obvious real fast that something had gone to hell in a handbasket. At least I know now why things went all bananas the last time I rebooted the physical server where authdns01 runs…
I have a systemd service for a Docker-based PowerDNS GUI by the way:
Started delving into the network data collected via collectd. Noticed that pve3 had pretty serious packet drop. Noticed it on my monitoring Banana Pi as well: each “host is online”-check sends out three pings and sometimes one of the three would fail.
Found some bad configuration with the trunks on my HP switch but that didn’t solve the problem. Maybe some VM on pve3 was using so much bandwidth it caused the host to drop packets? Let’s cap the VMs that can be suspected of using lots of bandwidth in bursts and see what happens.