MariaDB master/slave monitor

I have some scripts to do switchover and failover between two MariaDB-instances that I use for everything from PowerDNS backend, Grafana configuration data, Zabbix, my own backup program and some more things I can’t remember off the top of my head. I used to use Pacemaker for that but encountered some strange behavior and chose to make my own so that I could follow the logic of the process, something which is difficult in Pacemaker.

The logic here is simple. mutex01 is the intended master and mutex02 is the intended slave. mutex02 runs a script for failover that fences mutex01 if it stops working correctly and then takes over the role of master. mutex01 does not run a similar script or we could end up in a fencing bonanza where both nodes keep killing each other. This could be handled by using three nodes and voting but that adds complexity that I don’t need.

(The names comes from mutual exclusion which is abbreviated mutex. In a MariaDB master/slave setup there can be only one master at any one time. So mutual exclusion must be maintained. This is different from multimaster-systems like MariaDB Galera(which I used to run and yes, these are nested parentheses) and things like Elasticsearch and MongoDB which I run on three servers called multimaster01, multimaster02 and multimaster03.)

The same set of scripts allows for switchover, using some files as flags to indicate that a change is being processed to keep the failover script for instance from going bananas. But this is kind of… not very easy to keep track of. I frequently forget to reset the flags which keeps the failover script from working. Enter my Python/Flask app that exports information about MariaDB and the flags of the scripts for each node and a React-frontend to view the data:

Each panel is its own React component which is given a hostname and intended role as arguments:

Based on this information the data can be highlighted based on how it conforms to the expected state of each server. For instance, after a failover has occurred we see that mutex02 is no longer in read-only mode which mutex01 is in read-only mode and is replicating data from mutex02. This is entirely correct after failover has occurred but it’s still a matter of the system being in a degraded state that I should inspect and fix.

Hmm, I should probably set red markings on Slave IO Running = No and Slave SQL Running = No for the slave node. (Making mental note that I will soon forget)

Anyway, we see that the failover-flag has been set on mutex02 to prevent it from doing any monitoring of mutex01, fencing or even writing to the failover-log(as indicated by the age ofthe log at the bottom of the mutex02-column). I reset the failover flag on mutex02 and check that seconds_behind_master was OK(it is marked as red if it is greater than the time the switchover-script is willing to wait for the nodes to be in sync before giving up) and then ran the switchover_to_here.sh-script on mutex01.

After clearing the maintenance flag on both nodes failover_log_age dropped and stayed low(the failover script runs for like 50 seconds starting once a minute and keeps outputting data so the timestamp of the failover-log is typically no more than 10 seconds during normal operations.

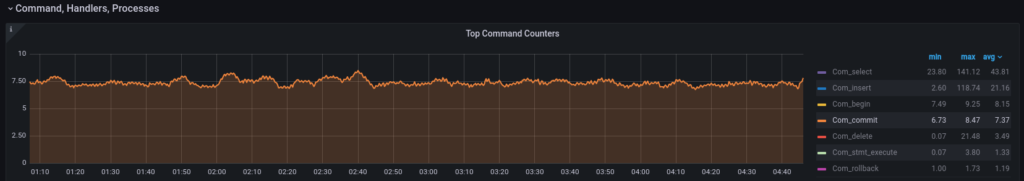
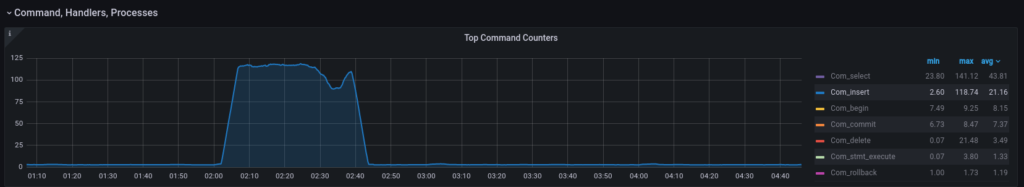
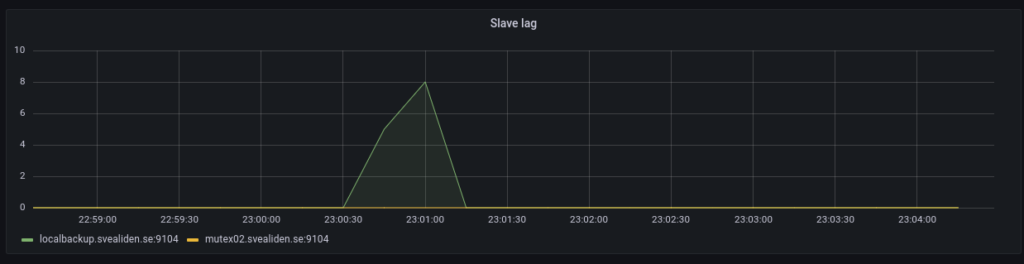
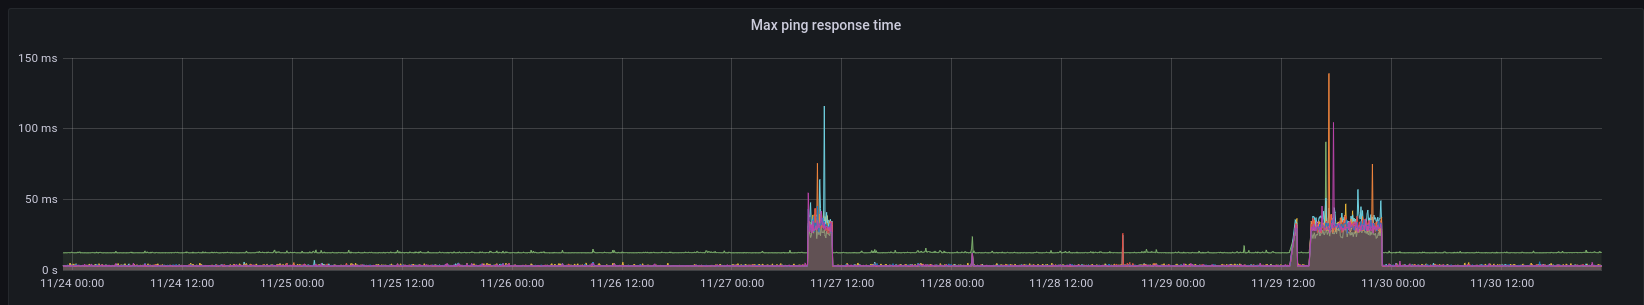
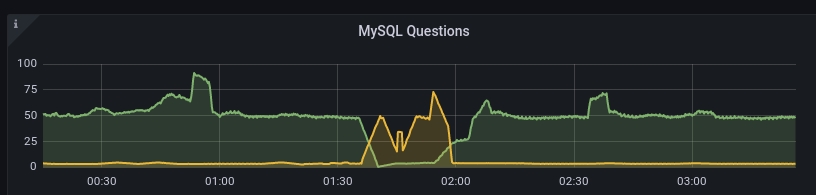
We can see how mutex01(green) stopped processing queries and how mutex02(yellow) took over and then how the switchover restored things in the Grafana graphs of Prometheus data:

All in all I’m pretty pleased with how this worked out. I may publish the failover/switchover scripts and possibly also the Python/Flask-stuff. The React app however is way too hacky. Example:

class ServerStatus extends React.Component {
  constructor(props) {
    super(props)
    this.state = {
      error: null,
      isLoaded: false,
      failover_flag: null,
      gtid_binlog_pos: null,
      exec_master_log_pos: null,
      gtid_position: null,
      gtid_slave_pos: null,
      last_io_errno: null,
      last_sql_errno: null,
      maintenance_flag: null,
      position_type: null,
      read_only: null,
      relay_log_space: null,
      seconds_behind_master: null,
      slave_io_running: null,
      slave_io_state: null,
      slave_sql_running: null,
      slave_transactional_groups: null,
      failover_log_age: null
    }
  }
// {"exec_master_log_pos":5274471,"failover_flag":0,"gtid_binlog_pos":"1-11-40976726","gtid_position":"1-12-38358929",
// "gtid_slave_pos":"1-12-38358929","last_io_errno":0,"last_sql_errno":0,"maintenance_flag":0,"position_type":"Current_Pos",
// "read_only":0,"relay_log_space":309452,"seconds_behind_master":null,"slave_io_running":"No","slave_io_state":"",
// "slave_sql_running":"No","slave_transactional_groups":455}
  fetchData = () => {
    fetch('http://' + this.props.servername + '.svealiden.se:5000/')
      .then((res) => res.json())
      .then(
        (result) => {
          //alert("result:" + JSON.stringify(result));
          this.setState({
            isLoaded: true,
            failover_flag: result['failover_flag'],
            gtid_binlog_pos: result['gtid_binlog_pos'],
            exec_master_log_pos: result['exec_master_log_pos'],
            gtid_position: result['gtid_position'],
            gtid_slave_pos: result['gtid_slave_pos'],
            last_io_errno: result['last_io_errno'],
            last_sql_errno: result['last_sql_errno'],
            maintenance_flag: result['maintenance_flag'],
            position_type: result['position_type'],

I’m pretty sure this isn’t how you’re supposed to do it… But it beats not having continuously updated information on the state of a MariaDB pair with halfway complex rules on what is correct and what isn’t correct.

Note that since I started using this script for my actual “workloads” I’ve had like four or five failures that required me to resynchronize nodes after failover and even switchover! I struggled for hours to deal with extraneous transactions that messed up the GTID-sequences only to finally learn that if you have tables with Engine=MEMORY you always get “DELETE FROM tablename” added at startup of MariaDB. That adds an extra local operation that gets master and slave out of sync. So I’m not using MEMORY tables any more. They were only there to avoid write-tests straining my hard drives which was kind of silly anyway.

But now things seem to have settled down and not even yesterday’s failover required my to resynchronize nodes. That’s otherwise something you should expect, that failover leaves you with the old master node being out of sync with the slave that has now taken over the master-role temporarily. Switchover is different as we are just moving the master role between two functioning systems so we can bail out of the process if something doesn’t work out correctly, keeping the master as master. Example from my script for failover:

  echo "Starting failover from $OTHERNODE to $THISNODE. $(date +%s)"
  echo "1" > "/root/failovermode"
  # Need to demote master if possible
  my
  if OTHERNODE_RO_MODE=$(mysql --connect-timeout=2 -N -s -B -h "$OTHERNODE" -B -N -e "SELECT @@GLOBAL.read_only;");
  then
    # If that worked we can check the return value
    if [ "$OTHERNODE_RO_MODE" = "1" ];
    then
      # We can become master without an issue in an emergency, 
      # but we should ideally wait for this node to catch up.
      echo "Other node is read_only now. Waiting for catchup. $(date +%s)"
      wait_for_catchup
      # Don't really care how we got out of wait for catchup, it's time to become master.
      promote_local
    elif [ "$OTHERNODE_RO_MODE" = "0" ];
    then
      echo "Failed to set $OTHERNODE to set read_only=1. Fencing!"
      if fence_other_node;
      then
        # Can't catch up since we don't know the master GTID
        echo "Fenced other node successfully. $(date +%s)"
        promote_local
        exit 0;
      else
        echo "Failed to fence master. Can't proceed. $(date +%s)"
        exit 1;
      fi # End fence_other_node check
    else
      echo "We received neither read_only=1 _or_ read_only=0. Shouldn't be possible."
    fi # End second OTHERNODE check run after sending read_only=1
  else
    echo "Couldn't check if $OTHERNODE is read_only. Must fence! $(date +%s)"
    if fence_other_node;
    then
      # Can't catch up since we don't know the master GTID
      echo "Fenced other node successfully. $(date +%s)"
      promote_local
      exit 0;
    else
      echo "Failed to fence master. Can't proceed. $(date +%s)"
      exit 1;
    fi # End fence_other_node check
  fi # End of check of return status from other node read_only-status
  exit 1

As you can see in the first nested if-statements we can wait for some time for the slave to catch up to the old master before promoting itself but we’re not going to wait indefinitely. We only failover if the master is slightly wonky so we can’t assume that the slave will always catch up(maybe the master sent back a bad GTID?). Same thing if we can’t even talk to the old master when failing over, we have no choice but to fence it. We wouldn’t know which GTID is the latest so saying “Let the old slave wait until it reaches GTID X before becoming master” makes no sense.

This has been a test of the audience’s patience.

MariaDB slave lag

Just a few notes on MariaDB replication lag. My own backup program is an interesting generator of database traffic as we can see below:

But the slaves catch up in a very jerky fashion:

On the face of it both nodes suddenly fell 1800 seconds behind in a matter of 60 seconds. I argue this would only be possible if 1800 seconds of updates were suddenly sent to or acknowledged by the slaves. The sending theory isn’t entirely unreasonable based on this graph:

Commits on the master are relatively evenly spaced:

And Inserts spread out over the whole intensive period:

I suspect this sudden lag increase is a result of changes being grouped together in “replication transactions”:

Global transaction ID introduces a new event attached to each event group in the binlog. (An event group is a collection of events that are always applied as a unit. They are best thought of as a “transaction”,[…]

Let’s check the relay log on mutex02 to see if this intuition is correct. Beginning of relevant segment:

#211215  2:31:06 server id 11  end_log_pos 674282324 CRC32 0xddf8eb3a   GTID 1-11-35599776 trans
/*!100001 SET @@session.gtid_seq_no=35599776*//*!*/;
START TRANSACTION
/*!*/;
# at 674282625
#211215  2:01:54 server id 11  end_log_pos 674282356 CRC32 0x8e673045   Intvar
SET INSERT_ID=22263313/*!*/;
# at 674282657
#211215  2:01:54 server id 11  end_log_pos 674282679 CRC32 0x9c098efd   Query   thread_id=517313        exec_time=0     error_code=0    xid=0
use `backuptool`/*!*/;
SET TIMESTAMP=1639530114/*!*/;
SET @@session.sql_mode=1411383304/*!*/;
/*!\C utf8mb4 *//*!*/;
SET @@session.character_set_client=224,@@session.collation_connection=224,@@session.collation_server=8/*!*/;
insert into FileObservation (hashsum, indexJob_id, mtime, path, size) values ('e182c2a36d73098ca92aed5a39206de151190a047befb14d2eb9e7992ea8e324', 284, '2018-06-08 22:21:16.638', '/srv/storage/Backup/2018-06-08-20-img-win7-laptop/Info-dmi.txt', 21828)

Ending with:

SET INSERT_ID=22458203/*!*/;
# at 761931263
#211215  2:31:05 server id 11  end_log_pos 761931294 CRC32 0x54704ba3   Query   thread_id=517313        exec_time=0     error_code=0    xid=0
SET TIMESTAMP=1639531865/*!*/;
insert into FileObservation (hashsum, indexJob_id, mtime, path, size) values ('e9b3dc7dac6e9f8098444a5a57cb55ac9e97b20162924cda9d292b10e6949482', 284, '202
1-12-14 08:28:00.23', '/srv/storage/Backup/Lenovo/Path/LENOVO/Configuration/Catalog1.edb', 23076864)
/*!*/;
# at 761931595
#211215  2:31:05 server id 11  end_log_pos 761931326 CRC32 0x584a7652   Intvar
SET INSERT_ID=22458204/*!*/;
# at 761931627
#211215  2:31:05 server id 11  end_log_pos 761931659 CRC32 0x6a9c8f8a   Query   thread_id=517313        exec_time=0     error_code=0    xid=0
SET TIMESTAMP=1639531865/*!*/;
insert into FileObservation (hashsum, indexJob_id, mtime, path, size) values ('84be690c4ff5aaa07adc052b15e814598ba4aad57ff819f58f34ee2e8d61b8a5', 284, '202
1-12-14 08:30:58.372', '/srv/storage/Backup/Lenovo/Path/LENOVO/Configuration/Catalog2.edb', 23076864)
/*!*/;
# at 761931960
#211215  2:31:06 server id 11  end_log_pos 761931690 CRC32 0x98e12680   Xid = 27234912
COMMIT/*!*/;
# at 761931991
#211215  2:31:06 server id 11  end_log_pos 761931734 CRC32 0x90f792f6   GTID 1-11-35599777 cid=27722058 trans
/*!100001 SET @@session.gtid_seq_no=35599777*//*!*/;

So it seems like 1-11-35599776 stretches from 02:01:54 to 2:31:06 and it’s somewhat reasonable for mutex02 to suddenly report a lag of 30 minutes. I wonder what that means for actual data transfer. Could I query intermediate results from 1-11-35599776 before 02:31? :thinking_face:

Bonus:

The tiny slave lag caused on the localbackup node when this is run:

 mysql -e "STOP SLAVE;" && sleep 8 && cd $SCRIPT_PATH && source bin/activate && python snapshots.py hourly >> hourly.log && mysql -e "START SLAVE;"

It’s a really hacky way to let the localbackup process any processing of the relay log before making a Btrfs snapshot. Seems to work. Technically you can make snapshots while MariaDB is running full tilt but this seems a bit nicer. Have had some very rare lockups of unknown origin on these kinds of Btrfs snapshot-nodes for database backups.

ISP issues

Bahnhof have had a bad couple of weeks around here. Two multi-hour outages and now packetloss has gone crazy.

I suspect however that it’s not their fault. They don’t own the fiber links between each property and the switching stations. Well, I don’t mind packet loss that much when I’m not working. If this keeps up I’ll have to switch over to the 4G backup manually before I start my shift on telephone support. YouTube is very PL-tolerant but VoIP? Not so much. It’s hard enough understanding what people are saying without syllables going missing…

Higher ping on 4G of course but not so high that it interferes with phone calls.

Zabbix and Prometheus

Zabbix is my favorite network monitoring solution despite having one or two flaws. It comes with great templates for servers, networking equipment and applications. I have had to put together my own crude templates for MongoDB, Samba, DNS lookups, Btrfs file systems and LVM thin pools but MySQL, Elasticsearch, Ceph and more has been effortless(-ish) to setup monitoring for in Zabbix. My main dashboard shows a list of problems, graphs over network usage and server load on the physical servers:

Admin/backup refers to my old HPE switch which is normally only used for IPMI but it’s part of a RSTP-setup so if something goes wrong with my new Aruba switch the old HPE will make sure the servers can communicate with each other and the gateway.

A nice feature in Zabbix is setting downtime so as to avoid lots of alerts when rebooting nodes or doing similar maintenance. One issue I have is that Zabbix is not designed for cluster use. It’s technically not impossible to have two parallel instances running but then you’ll get a lot of wonky data as two nodes add and subtract data from the database without knowing about each other. I think a Pacemaker-setup that enforces mutual exclusion would work but I don’t really have a need for that. I am thinking about running Zabbix as a Docker container to make it easier to spin up on a backup server when I have to take a server down for maintenance.

Zabbix is extensible with both your own templates and custom data collection mechanisms. For instance I added this in zabbix_agent.conf on my MongoDB nodes to provide data for the Zabbix server:

UserParameter=mongodb.uptime, /etc/zabbix/mongodb_uptime.sh
UserParameter=mongodb.reachable, mongo --eval "rs.status().ok" | tail -1

Ordinary commands, calls to scripts and pretty much everything in between. Consider formatting it as JSON if it’s more than scalar values being passed back to the Zabbix server.

I only just learned today that Zabbix also has a function for running commands in response to error states: https://www.zabbix.com/documentation/current/manual/config/notifications/action/operation/remote_command

I don’t usually run in to repeat problems on my systems(no silly customers causing trouble and hardly any publically facing services) that make it sensible to use that but at work we could definitely use that kind of solution.

That leads me to a downside to Zabbix, the RDBMS backend… I run MariaDB master/slave now but used MariaDB Galera before and it works fine for my needs. I’m not sure how well Zabbix scales though. For my modest network with 21 active data collection sources we have around 40 queries per second but if we were talking about 21 physical servers and 500 virtual machines… Not to mention that RDBMS are kind of a pain generally since they don’t respond well to unexpected shutdowns and such.

Prometheus

Zabbix does its job exceedingly well but it’s also kind of boring and… not modern. So for every mention of Zabbix you’ll see 1000 mentions about Prometheus. Despite being a bit of a Zabbix fan boy, I have to give credit to Prometheus for doing performance monitoring really well. It’s not just a lot of hype about Prometheus, it’s actually quite good. It is very efficient when it comes to storing time series data which it does using an internal storage system and not a sensitive RDBMS-arrangement.

It comes with it’s own crude table-and-graphing web UI. Using something like Grafana is however recommended for production use when presenting Prometheus data. For instance, here is dashboard of Prometheus data for my network indicating if things are overloaded or degraded(during a big upgrade yesterday):

As you can see, I like heatmaps. Red are peaks in usage and black squares(well, rectangles…) are periods where data is missing. It normally looks like this:

There are lots of “exporters” as clients are called in Prometheus for exporting data about Linux servers and applications and it’s also easy to write your own. I have an exporter for gathering packet loss-data both on my own network and against external servers and it took me like 45 minutes to do, starting with no knowledge of what a Prometheus exporter is or how it works. With a node exporter for something like MySQL and a provided Grafana dashboard you can get really good monitoring in a very short period of time. My MySQL master for instance:

Where Prometheus is kind of weak is alerting which has to be done through rules read into the Prometheus config file: https://prometheus.io/docs/prometheus/latest/configuration/alerting_rules/

It’s not that it doesn’t work but Zabbix does this more conveniently and has it’s own interface for presenting alerts, acknowledging them and so on. Prometheus has an alert manager sidecar sort of thing but I’m preferring to implement all important alerts in Zabbix and using Prometheus alerts only for more general “something doesn’t seem quite right” performance stuff.

All in all I wouldn’t want to rely on Zabbix for performance metrics and I certainly wouldn’t want to have to rely on Prometheus for alerting. If I had to deal with thousands of servers running hundreds of thousands of application instances or something crazy like that I’d go with Prometheus, not least thanks to its federation-capability of summarizing data upwards in a tree of Prometheus instances, never mind that I’d have to write a bunch of rules manually that I’d get for free with Zabbix.

Federation could also be used for higher availability though it would be a little bit weird perhaps. Well, no… If you just let a backup gather data while the primary is rebooted and then let the primary read the data it missed from the backup then we’d be back where we wanted to be, right? I guess I should try out that federation stuff some time.

WooCommerce monitoring

This is a follow-up to HA WooCommerce on a budget. Now we add monitoring using Zabbix so that we can keep track of services failing, load, queries per second. Installing Zabbix can be a bit of a hassle the first time around and I succeeded in having a big hassle the… What is this? Fourth time I install it? Using the RHEL repo for installing Fedora 33 seems to not work great. On Ubuntu it’s easy:

wget https://repo.zabbix.com/zabbix/5.0/ubuntu/pool/main/z/zabbix-release/zabbix-release_5.0-1+focal_all.deb
dpkg -i zabbix-release_5.0-1+focal_all.deb
apt update
apt install zabbix-server-mysql zabbix-frontend-php zabbix-nginx-conf zabbix-agent

You’ll have to enter the right information in /etc/zabbix/zabbix_server.conf for how to connect to the database, as defined when you created the database:

MariaDB [(none)]> create database zabbix character set utf8 collate utf8_bin;
MariaDB [(none)]> create user zabbix@'%' IDENTIFIED BY 'SECRETPASSWORD';

That database also needs to be populated with the right tables:

zcat /usr/share/doc/zabbix-server-mysql/create.sql.gz | mysql -h 192.168.1.209 -u zabbix -p zabbix

192.168.1.209 is the virtual IP for the MariaDB master in my temporary Pacemaker cluster. Needed a way to write data to it continuously so I could test switchover and why not kill two birds with one stone?

VPN

To make my life easier I expanded the VPN for the primary/backup pair to include the monitor server. On primary the /etc/wireguard/wg0.conf looks like this:

[Interface]
PrivateKey =  PRIVKEY_FOR_PRIMARY
Address = 10.0.0.1/24
PostUp = iptables -A FORWARD -i wg0 -j ACCEPT; iptables -t nat -A POSTROUTING -o eth0 -j MASQUERADE
PostDown = iptables -D FORWARD -i wg0 -j ACCEPT; iptables -t nat -D POSTROUTING -o eth0 -j MASQUERADE
ListenPort = 51820

[Peer]
PublicKey = PUBKEY_FOR_BACKUP
AllowedIPs = 10.0.0.2/32

[Peer]
PublicKey = PUBKEY_FOR_MONITOR
AllowedIPs = 10.0.0.3/32

On backup:

[Interface]
Address = 10.0.0.2/32
PostUp = iptables -A FORWARD -i wg0 -j ACCEPT; iptables -t nat -A POSTROUTING -o eth0 -j MASQUERADE
PostDown = iptables -D FORWARD -i wg0 -j ACCEPT; iptables -t nat -D POSTROUTING -o eth0 -j MASQUERADE
PrivateKey = PRIVKEY_FOR_BACKUP
ListenPort = 51820

[Peer]
PublicKey = PUBKEY_FOR_PRIMARY
Endpoint = 13.49.145.244:51820
AllowedIPs = 10.0.0.1/24

[Peer]
PublicKey = PUBKEY_FOR_MONITOR
AllowedIPs = 10.0.0.3/32

And on the monitor:

[Interface]
Address = 10.0.0.3/32
PostUp = iptables -A FORWARD -i wg0 -j ACCEPT; iptables -t nat -A POSTROUTING -o eth0 -j MASQUERADE
PostDown = iptables -D FORWARD -i wg0 -j ACCEPT; iptables -t nat -D POSTROUTING -o eth0 -j MASQUERADE
PrivateKey = PRIVKEY_FOR_MONITOR

[Peer]
PublicKey = PUBKEY_FOR_PRIMARY
Endpoint = 13.49.145.244:51820
AllowedIPs = 10.0.0.1/24

[Peer]
PublicKey = /WbR1A3hQg3gyYMpHvCLTmMqIlhxZDrfcMaop19BGzA=
Endpoint = 185.20.12.24:51820
AllowedIPs = PUBKEY_FOR_BACKUP

User parameters

We need to be able to access MariaDB’s status variables for a thing later on so we need to add something to cat /etc/zabbix/zabbix_agentd.d/userparameter_mysql.conf :

UserParameter=mysql.variables[*], mysql -h"$1" -P"$2" -sNX -e "show variables"

Zabbix agents

The easiest way to monitor servers is to install Zabbix Agent on them. SNMP and other methods are available but when you can use the Agent-method then that’s typically easier. Install on RHEL:

rpm -Uvh https://repo.zabbix.com/zabbix/5.2/rhel/8/x86_64/zabbix-release-5.2-1.el8.noarch.rpm
dnf clean all
dnf install zabbix-agent
systemctl enable zabbix-agent

Install on Ubuntu:

wget https://repo.zabbix.com/zabbix/5.0/ubuntu/pool/main/z/zabbix-release/zabbix-release_5.0-1+focal_all.deb
dpkg -i zabbix-release_5.0-1+focal_all.deb
apt update
apt install zabbix-agent

Both need their /etc/zabbix/zabbix_agentd.conf edited so that Server, ServerActive and Hostname are set correctly. Server and ServerActive should be the IP address of the monitor, in this case 10.0.0.3. Hostname should reflect the nodes own name.

Customization

Adding the nodes to Zabbix is easy enough so I won’t demonstrate that but adding templates isn’t necessary all that obvious(like that you pretty much have to add them to make Zabbix do anything). Here I’m adding some standard templates for Linux servers and also MySQL. I added Nginx as well.

Now let’s create two items manually, one for primary and one for backup. They’ll do the same thing, get status variables and extract the “read_only” variable that tells us if the node is accepting MariaDB writes:

We need to process the output to get a readable value using Preprocessing:

We can then add triggers. primary should normally be read-write so if it is read-only. That should trigger a warning. The opposite is true for backup:

It also became clear that I should have a check for backup server running the failover service:

And a trigger to go along with that of course:

Zero running failover daemon is bad you see. Don’t ask me what prompted me to realize the necessity of having an automated warning for this.

You’ll probably want to customize the MySQL by Zabbix Agent template in this sort of situation.

  • Set replication discovery to run every 5 minutes.
  • Make it possible to manually close the warning about a server not replicating from a master(since we will be switching master/slave roles these warnings can be spurious).
  • Disable warnings about InnoDB pool utlization:

Dashboards

It’s easy to create dashboards with information you find particularly useful:

Warnings

You’ll want to go to the Administration->Media Types section to enable ways for Zabbix to alert you to things going wrong. I use email only for my own network but for a production setup you’d probably want PushOver or OpsGenie to alert you more forcefully when things go south.

Zabbix

Most of the writes to my database comes from the monitoring solution Zabbix(which is really nice). I first had to modify the SQL file that is used to create the database for Zabbix since Percona XtraDB cluster demands that all tables have a primary key. I similarly had to modify the template used by Zabbix to graph Ceph-data but now I’m feeding that data to InfluxDB and Grafana instead.

I’m a little bit skeptical about using MySQL as a backend for monitoring data generally but apart from that I’m really pleased with Zabbix. I’ve used Nagios, Cacti, OpenNMS and briefly even Zenoss back in the day but don’t miss them. Especially not Cacti…

For most hosts I use Zabbix Agent for data collection but for networking equipment SNMP is used.

I could use IPMI as well for my physical servers but that already goes to Grafana via collectd. I feel like Grafana is good for performance monitoring while Zabbix does better with keeping track of things being up and running. It has great default settings, keeping track of swap space, IO Wait and so on with built-in triggers that generate alerts. Grafana can do lots of that but with more effort.

Having installed zabbix-agent and modified zabbix_agent.conf manually like 50 times in the past two months I’m really starting to pine for Puppet. Same for collectd. I wonder if Puppet can enroll servers in FreeIPA as well? Hmm…