Just a few notes on MariaDB replication lag. My own backup program is an interesting generator of database traffic as we can see below:

But the slaves catch up in a very jerky fashion:

On the face of it both nodes suddenly fell 1800 seconds behind in a matter of 60 seconds. I argue this would only be possible if 1800 seconds of updates were suddenly sent to or acknowledged by the slaves. The sending theory isn’t entirely unreasonable based on this graph:

Commits on the master are relatively evenly spaced:

And Inserts spread out over the whole intensive period:

I suspect this sudden lag increase is a result of changes being grouped together in “replication transactions”:
Global transaction ID introduces a new event attached to each event group in the binlog. (An event group is a collection of events that are always applied as a unit. They are best thought of as a “transaction”,[…]
Let’s check the relay log on mutex02 to see if this intuition is correct. Beginning of relevant segment:
#211215  2:31:06 server id 11  end_log_pos 674282324 CRC32 0xddf8eb3a   GTID 1-11-35599776 trans
/*!100001 SET @@session.gtid_seq_no=35599776*//*!*/;
START TRANSACTION
/*!*/;
# at 674282625
#211215  2:01:54 server id 11  end_log_pos 674282356 CRC32 0x8e673045   Intvar
SET INSERT_ID=22263313/*!*/;
# at 674282657
#211215  2:01:54 server id 11  end_log_pos 674282679 CRC32 0x9c098efd   Query   thread_id=517313        exec_time=0     error_code=0    xid=0
use `backuptool`/*!*/;
SET TIMESTAMP=1639530114/*!*/;
SET @@session.sql_mode=1411383304/*!*/;
/*!\C utf8mb4 *//*!*/;
SET @@session.character_set_client=224,@@session.collation_connection=224,@@session.collation_server=8/*!*/;
insert into FileObservation (hashsum, indexJob_id, mtime, path, size) values ('e182c2a36d73098ca92aed5a39206de151190a047befb14d2eb9e7992ea8e324', 284, '2018-06-08 22:21:16.638', '/srv/storage/Backup/2018-06-08-20-img-win7-laptop/Info-dmi.txt', 21828)
Ending with:
SET INSERT_ID=22458203/*!*/;
# at 761931263
#211215  2:31:05 server id 11  end_log_pos 761931294 CRC32 0x54704ba3   Query   thread_id=517313        exec_time=0     error_code=0    xid=0
SET TIMESTAMP=1639531865/*!*/;
insert into FileObservation (hashsum, indexJob_id, mtime, path, size) values ('e9b3dc7dac6e9f8098444a5a57cb55ac9e97b20162924cda9d292b10e6949482', 284, '202
1-12-14 08:28:00.23', '/srv/storage/Backup/Lenovo/Path/LENOVO/Configuration/Catalog1.edb', 23076864)
/*!*/;
# at 761931595
#211215  2:31:05 server id 11  end_log_pos 761931326 CRC32 0x584a7652   Intvar
SET INSERT_ID=22458204/*!*/;
# at 761931627
#211215  2:31:05 server id 11  end_log_pos 761931659 CRC32 0x6a9c8f8a   Query   thread_id=517313        exec_time=0     error_code=0    xid=0
SET TIMESTAMP=1639531865/*!*/;
insert into FileObservation (hashsum, indexJob_id, mtime, path, size) values ('84be690c4ff5aaa07adc052b15e814598ba4aad57ff819f58f34ee2e8d61b8a5', 284, '202
1-12-14 08:30:58.372', '/srv/storage/Backup/Lenovo/Path/LENOVO/Configuration/Catalog2.edb', 23076864)
/*!*/;
# at 761931960
#211215  2:31:06 server id 11  end_log_pos 761931690 CRC32 0x98e12680   Xid = 27234912
COMMIT/*!*/;
# at 761931991
#211215  2:31:06 server id 11  end_log_pos 761931734 CRC32 0x90f792f6   GTID 1-11-35599777 cid=27722058 trans
/*!100001 SET @@session.gtid_seq_no=35599777*//*!*/;
So it seems like 1-11-35599776 stretches from 02:01:54 to 2:31:06 and it’s somewhat reasonable for mutex02 to suddenly report a lag of 30 minutes. I wonder what that means for actual data transfer. Could I query intermediate results from 1-11-35599776 before 02:31? :thinking_face:
Bonus:
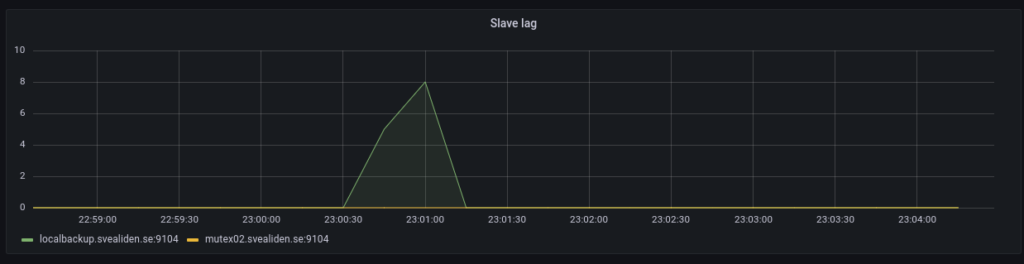
The tiny slave lag caused on the localbackup node when this is run:
mysql -e "STOP SLAVE;" && sleep 8 && cd $SCRIPT_PATH && source bin/activate && python snapshots.py hourly >> hourly.log && mysql -e "START SLAVE;"
It’s a really hacky way to let the localbackup process any processing of the relay log before making a Btrfs snapshot. Seems to work. Technically you can make snapshots while MariaDB is running full tilt but this seems a bit nicer. Have had some very rare lockups of unknown origin on these kinds of Btrfs snapshot-nodes for database backups.