This is a follow-up to HA WooCommerce on a budget. Now we add monitoring using Zabbix so that we can keep track of services failing, load, queries per second. Installing Zabbix can be a bit of a hassle the first time around and I succeeded in having a big hassle the… What is this? Fourth time I install it? Using the RHEL repo for installing Fedora 33 seems to not work great. On Ubuntu it’s easy:
wget https://repo.zabbix.com/zabbix/5.0/ubuntu/pool/main/z/zabbix-release/zabbix-release_5.0-1+focal_all.deb
dpkg -i zabbix-release_5.0-1+focal_all.deb
apt update
apt install zabbix-server-mysql zabbix-frontend-php zabbix-nginx-conf zabbix-agent
You’ll have to enter the right information in /etc/zabbix/zabbix_server.conf for how to connect to the database, as defined when you created the database:
MariaDB [(none)]> create database zabbix character set utf8 collate utf8_bin;
MariaDB [(none)]> create user zabbix@'%' IDENTIFIED BY 'SECRETPASSWORD';
That database also needs to be populated with the right tables:
zcat /usr/share/doc/zabbix-server-mysql/create.sql.gz | mysql -h 192.168.1.209 -u zabbix -p zabbix192.168.1.209 is the virtual IP for the MariaDB master in my temporary Pacemaker cluster. Needed a way to write data to it continuously so I could test switchover and why not kill two birds with one stone?
VPN
To make my life easier I expanded the VPN for the primary/backup pair to include the monitor server. On primary the /etc/wireguard/wg0.conf looks like this:
[Interface]
PrivateKey =  PRIVKEY_FOR_PRIMARY
Address = 10.0.0.1/24
PostUp = iptables -A FORWARD -i wg0 -j ACCEPT; iptables -t nat -A POSTROUTING -o eth0 -j MASQUERADE
PostDown = iptables -D FORWARD -i wg0 -j ACCEPT; iptables -t nat -D POSTROUTING -o eth0 -j MASQUERADE
ListenPort = 51820

[Peer]
PublicKey = PUBKEY_FOR_BACKUP
AllowedIPs = 10.0.0.2/32

[Peer]
PublicKey = PUBKEY_FOR_MONITOR
AllowedIPs = 10.0.0.3/32
On backup:
[Interface]
Address = 10.0.0.2/32
PostUp = iptables -A FORWARD -i wg0 -j ACCEPT; iptables -t nat -A POSTROUTING -o eth0 -j MASQUERADE
PostDown = iptables -D FORWARD -i wg0 -j ACCEPT; iptables -t nat -D POSTROUTING -o eth0 -j MASQUERADE
PrivateKey = PRIVKEY_FOR_BACKUP
ListenPort = 51820

[Peer]
PublicKey = PUBKEY_FOR_PRIMARY
Endpoint = 13.49.145.244:51820
AllowedIPs = 10.0.0.1/24

[Peer]
PublicKey = PUBKEY_FOR_MONITOR
AllowedIPs = 10.0.0.3/32
And on the monitor:
[Interface]
Address = 10.0.0.3/32
PostUp = iptables -A FORWARD -i wg0 -j ACCEPT; iptables -t nat -A POSTROUTING -o eth0 -j MASQUERADE
PostDown = iptables -D FORWARD -i wg0 -j ACCEPT; iptables -t nat -D POSTROUTING -o eth0 -j MASQUERADE
PrivateKey = PRIVKEY_FOR_MONITOR

[Peer]
PublicKey = PUBKEY_FOR_PRIMARY
Endpoint = 13.49.145.244:51820
AllowedIPs = 10.0.0.1/24

[Peer]
PublicKey = /WbR1A3hQg3gyYMpHvCLTmMqIlhxZDrfcMaop19BGzA=
Endpoint = 185.20.12.24:51820
AllowedIPs = PUBKEY_FOR_BACKUP
User parameters
We need to be able to access MariaDB’s status variables for a thing later on so we need to add something to cat /etc/zabbix/zabbix_agentd.d/userparameter_mysql.conf :
UserParameter=mysql.variables[*], mysql -h"$1" -P"$2" -sNX -e "show variables"
Zabbix agents
The easiest way to monitor servers is to install Zabbix Agent on them. SNMP and other methods are available but when you can use the Agent-method then that’s typically easier. Install on RHEL:
rpm -Uvh https://repo.zabbix.com/zabbix/5.2/rhel/8/x86_64/zabbix-release-5.2-1.el8.noarch.rpm
dnf clean all
dnf install zabbix-agent
systemctl enable zabbix-agent
Install on Ubuntu:
wget https://repo.zabbix.com/zabbix/5.0/ubuntu/pool/main/z/zabbix-release/zabbix-release_5.0-1+focal_all.deb
dpkg -i zabbix-release_5.0-1+focal_all.deb
apt update
apt install zabbix-agent
Both need their /etc/zabbix/zabbix_agentd.conf edited so that Server, ServerActive and Hostname are set correctly. Server and ServerActive should be the IP address of the monitor, in this case 10.0.0.3. Hostname should reflect the nodes own name.
Customization
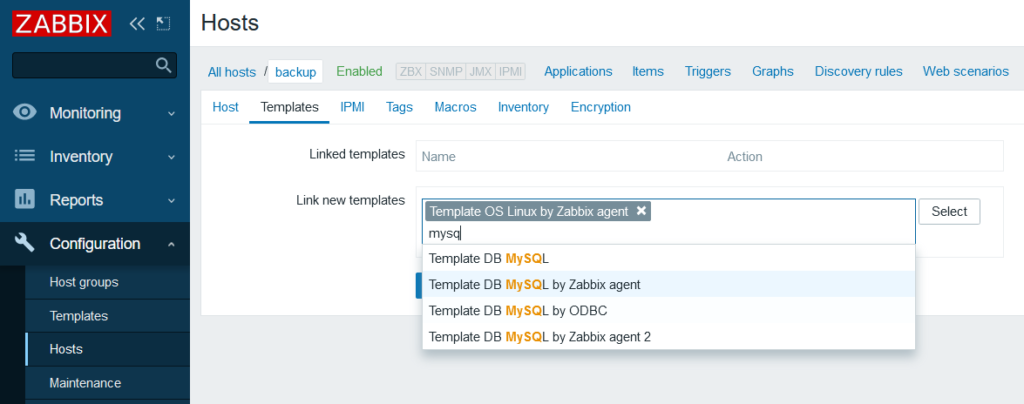
Adding the nodes to Zabbix is easy enough so I won’t demonstrate that but adding templates isn’t necessary all that obvious(like that you pretty much have to add them to make Zabbix do anything). Here I’m adding some standard templates for Linux servers and also MySQL. I added Nginx as well.
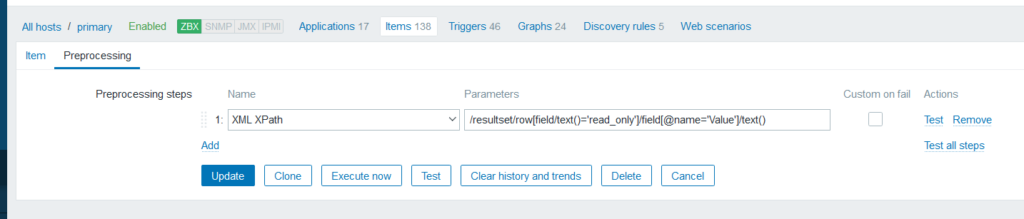
Now let’s create two items manually, one for primary and one for backup. They’ll do the same thing, get status variables and extract the “read_only” variable that tells us if the node is accepting MariaDB writes:

We need to process the output to get a readable value using Preprocessing:
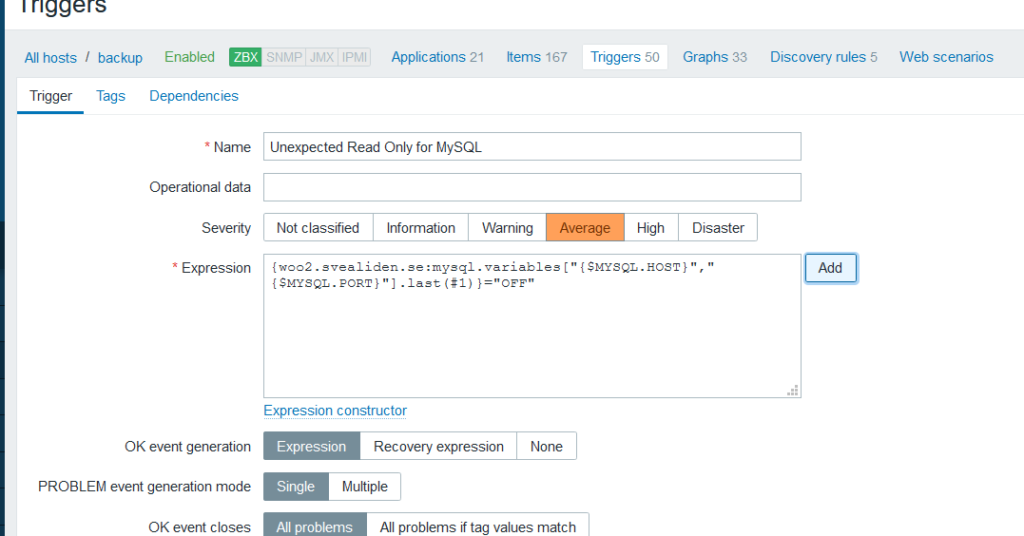
We can then add triggers. primary should normally be read-write so if it is read-only. That should trigger a warning. The opposite is true for backup:
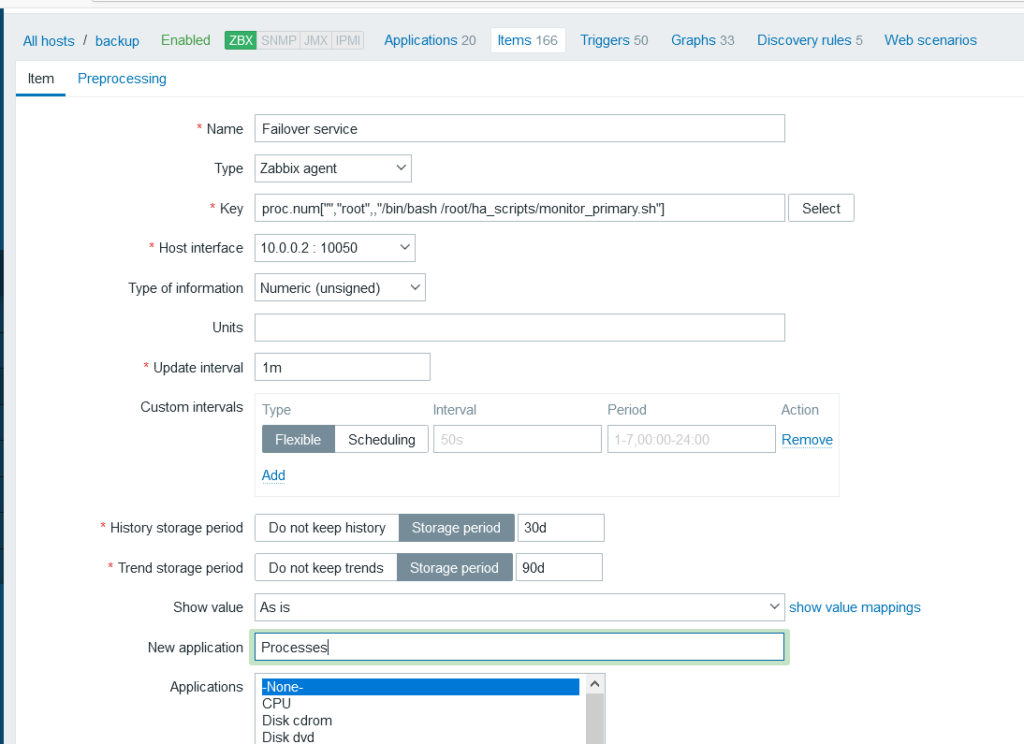
It also became clear that I should have a check for backup server running the failover service:
And a trigger to go along with that of course:
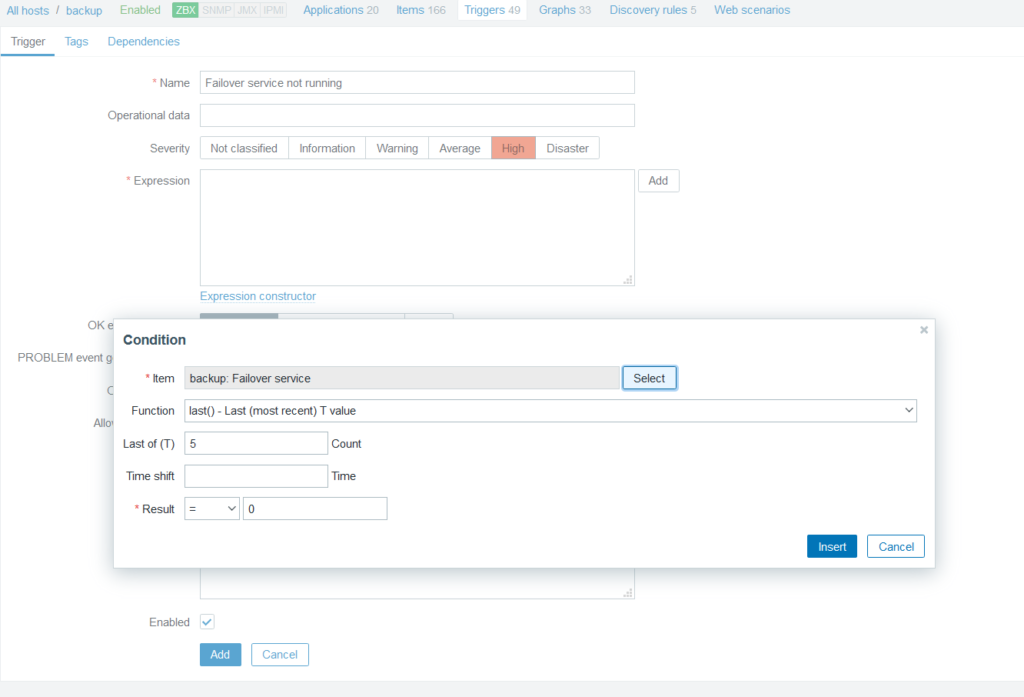
Zero running failover daemon is bad you see. Don’t ask me what prompted me to realize the necessity of having an automated warning for this.
You’ll probably want to customize the MySQL by Zabbix Agent template in this sort of situation.
- Set replication discovery to run every 5 minutes.
- Make it possible to manually close the warning about a server not replicating from a master(since we will be switching master/slave roles these warnings can be spurious).
- Disable warnings about InnoDB pool utlization:

Dashboards
It’s easy to create dashboards with information you find particularly useful:

Warnings
You’ll want to go to the Administration->Media Types section to enable ways for Zabbix to alert you to things going wrong. I use email only for my own network but for a production setup you’d probably want PushOver or OpsGenie to alert you more forcefully when things go south.