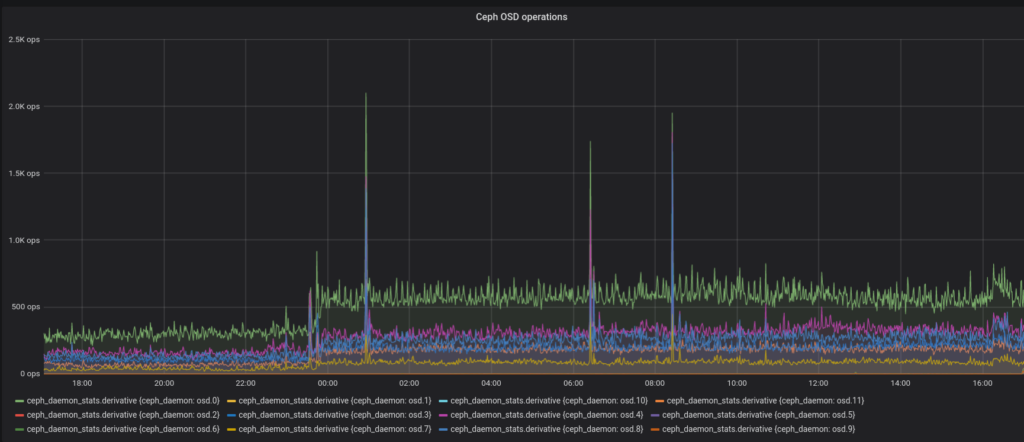
Look at this graph of operation count per 10 seconds in my Ceph cluster and see if you can tell at which point I started installing CollectD on more hosts on my network to feed into InfluxDB.
Yeah…
The bump at the end is where I started moving some things around. After this time series there’s a 1 hour gap in InfluxDB data while I moved its storage from RDB to a local SSD. Also some reboots of the Proxmox nodes to put one network interface per node to a new VLAN.
Anyway, no high availability for my InfluxDB server but also a more reasonable load on Ceph. I’ll consider doing the same to logger(my Elastic Stack VM) because it’s also highly expendable and it’s easy to imagine it also causing a high number of write operations. It’s not like my Ceph cluster can’t handle this amount of writes but I just don’t like performance and log monitoring causing 80% of the load.