Zabbix is my favorite network monitoring solution despite having one or two flaws. It comes with great templates for servers, networking equipment and applications. I have had to put together my own crude templates for MongoDB, Samba, DNS lookups, Btrfs file systems and LVM thin pools but MySQL, Elasticsearch, Ceph and more has been effortless(-ish) to setup monitoring for in Zabbix. My main dashboard shows a list of problems, graphs over network usage and server load on the physical servers:

Admin/backup refers to my old HPE switch which is normally only used for IPMI but it’s part of a RSTP-setup so if something goes wrong with my new Aruba switch the old HPE will make sure the servers can communicate with each other and the gateway.
A nice feature in Zabbix is setting downtime so as to avoid lots of alerts when rebooting nodes or doing similar maintenance. One issue I have is that Zabbix is not designed for cluster use. It’s technically not impossible to have two parallel instances running but then you’ll get a lot of wonky data as two nodes add and subtract data from the database without knowing about each other. I think a Pacemaker-setup that enforces mutual exclusion would work but I don’t really have a need for that. I am thinking about running Zabbix as a Docker container to make it easier to spin up on a backup server when I have to take a server down for maintenance.
Zabbix is extensible with both your own templates and custom data collection mechanisms. For instance I added this in zabbix_agent.conf on my MongoDB nodes to provide data for the Zabbix server:
UserParameter=mongodb.uptime, /etc/zabbix/mongodb_uptime.sh
UserParameter=mongodb.reachable, mongo --eval "rs.status().ok" | tail -1
Ordinary commands, calls to scripts and pretty much everything in between. Consider formatting it as JSON if it’s more than scalar values being passed back to the Zabbix server.
I only just learned today that Zabbix also has a function for running commands in response to error states: https://www.zabbix.com/documentation/current/manual/config/notifications/action/operation/remote_command
I don’t usually run in to repeat problems on my systems(no silly customers causing trouble and hardly any publically facing services) that make it sensible to use that but at work we could definitely use that kind of solution.
That leads me to a downside to Zabbix, the RDBMS backend… I run MariaDB master/slave now but used MariaDB Galera before and it works fine for my needs. I’m not sure how well Zabbix scales though. For my modest network with 21 active data collection sources we have around 40 queries per second but if we were talking about 21 physical servers and 500 virtual machines… Not to mention that RDBMS are kind of a pain generally since they don’t respond well to unexpected shutdowns and such.
Prometheus
Zabbix does its job exceedingly well but it’s also kind of boring and… not modern. So for every mention of Zabbix you’ll see 1000 mentions about Prometheus. Despite being a bit of a Zabbix fan boy, I have to give credit to Prometheus for doing performance monitoring really well. It’s not just a lot of hype about Prometheus, it’s actually quite good. It is very efficient when it comes to storing time series data which it does using an internal storage system and not a sensitive RDBMS-arrangement.
It comes with it’s own crude table-and-graphing web UI. Using something like Grafana is however recommended for production use when presenting Prometheus data. For instance, here is dashboard of Prometheus data for my network indicating if things are overloaded or degraded(during a big upgrade yesterday):
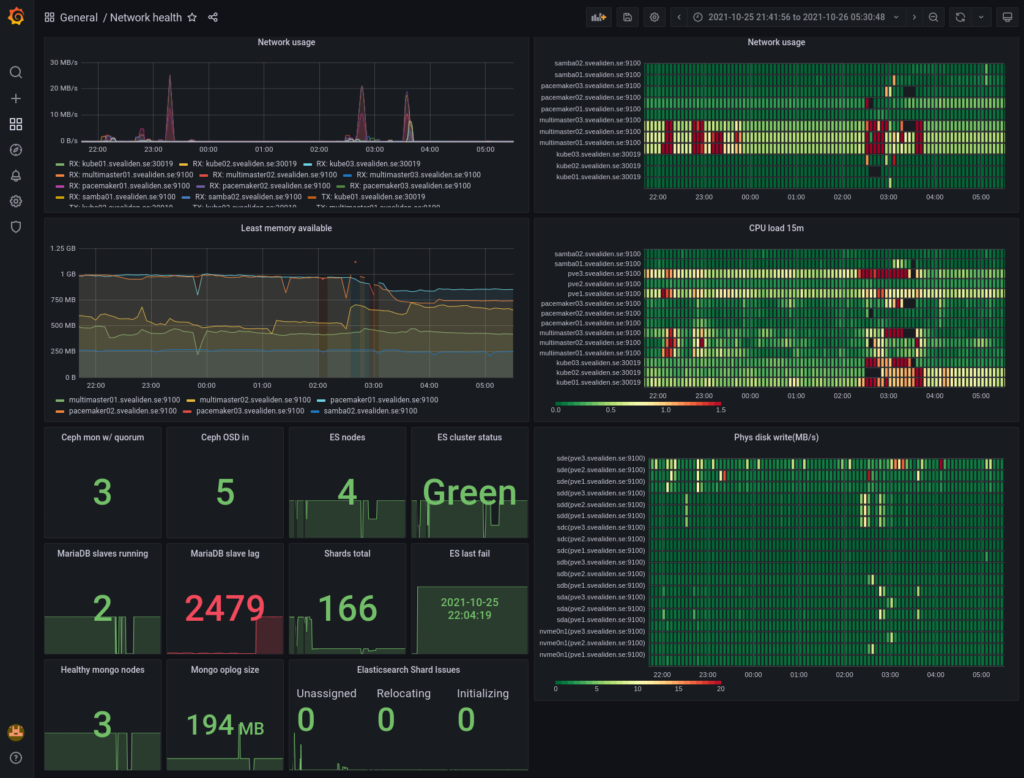
As you can see, I like heatmaps. Red are peaks in usage and black squares(well, rectangles…) are periods where data is missing. It normally looks like this:

There are lots of “exporters” as clients are called in Prometheus for exporting data about Linux servers and applications and it’s also easy to write your own. I have an exporter for gathering packet loss-data both on my own network and against external servers and it took me like 45 minutes to do, starting with no knowledge of what a Prometheus exporter is or how it works. With a node exporter for something like MySQL and a provided Grafana dashboard you can get really good monitoring in a very short period of time. My MySQL master for instance:

Where Prometheus is kind of weak is alerting which has to be done through rules read into the Prometheus config file: https://prometheus.io/docs/prometheus/latest/configuration/alerting_rules/
It’s not that it doesn’t work but Zabbix does this more conveniently and has it’s own interface for presenting alerts, acknowledging them and so on. Prometheus has an alert manager sidecar sort of thing but I’m preferring to implement all important alerts in Zabbix and using Prometheus alerts only for more general “something doesn’t seem quite right” performance stuff.
All in all I wouldn’t want to rely on Zabbix for performance metrics and I certainly wouldn’t want to have to rely on Prometheus for alerting. If I had to deal with thousands of servers running hundreds of thousands of application instances or something crazy like that I’d go with Prometheus, not least thanks to its federation-capability of summarizing data upwards in a tree of Prometheus instances, never mind that I’d have to write a bunch of rules manually that I’d get for free with Zabbix.
Federation could also be used for higher availability though it would be a little bit weird perhaps. Well, no… If you just let a backup gather data while the primary is rebooted and then let the primary read the data it missed from the backup then we’d be back where we wanted to be, right? I guess I should try out that federation stuff some time.